Last updated: September 2026.
Automated SEO reports are SEO performance reports that pull data from Google Search Console, Google Analytics 4 (GA4) and your rank tracker on their own, refresh without any copy-and-paste, and arrive in your inbox (or your client’s) on a schedule. You build the report once. After that, the only recurring work is reading the numbers and explaining them.
Automation handles the mechanical parts of reporting well and the judgment calls badly:
- Automate: data collection, charts and tables, date comparisons, scheduled delivery, and alerts when something drops or breaks.
- Keep human: the analysis (why a number moved), the recommendations (what happens next), and a final check before a client sees it.
This guide covers what to include, how to set up automated reports step by step (with a free route in Data Studio, the Google tool called Looker Studio until April 2026), how monitoring differs from reporting, which cadence to use, and the data limits behind most broken or misleading reports.
What are automated SEO reports?
An automated SEO report is a template connected to live data sources. Each time it runs, it fetches the latest data, applies the same filters and date ranges, and delivers the result in the same format. Most setups have four layers:

- Data collection: connectors pull data from Search Console, GA4, a rank tracker and, optionally, a backlink tool.
- Visualization: a template turns the data into scorecards, trend charts and tables.
- Delivery: a schedule sends a PDF or link by email at a set time.
- Alerts: separate rules watch for sudden changes between reports, such as a traffic drop or a new indexing problem.
Automated reports vs. automated SEO dashboards
A dashboard is a live page your team can open any time. A scheduled report is a snapshot of it for a fixed period, pushed to people who won’t log in. Most agencies need both: a live dashboard for the SEO team and a monthly PDF or link for the client. In Data Studio they’re the same file. You build the dashboard, then schedule delivery of selected pages.
Benefits of automated SEO reporting
The benefits come from removing manual steps that are slow and easy to get wrong:
- Time back every cycle. No logging into four tools, exporting CSVs and rebuilding charts. That time goes into analysis.
- Consistency. The same metrics, filters and comparison periods every time, so this month is actually comparable with last month.
- Fewer errors. No copy-paste means no wrong column, stale screenshot or missing filter.
- Earlier warning. With alerts on top, you hear about a traffic drop or indexing problem days before the next report would show it.
- Predictable client updates. Results arrive on a fixed day, which cuts down on “how are we doing?” emails.
- Scale. One template can serve many clients by swapping the data source.
How much time does it save? That depends on your current process, so time it rather than trust a benchmark. As an illustrative estimate: if a manual monthly report takes 90 minutes per client (exporting, pasting, formatting, sending) and the automated version takes 20 minutes (checking numbers, writing commentary), you save about 70 minutes per client per month, or about 17.5 hours a month across 15 clients. Leaner manual reports mean smaller savings.
What to include in an automated SEO report
Start from the reader. A client or executive wants to know whether organic search is producing business results. An SEO team needs the detail to decide what to work on next. Use one set of data sources and give each audience its own page or report.
| Metric | Source | Client / exec report | SEO team report |
|---|---|---|---|
| Organic leads, sales or revenue | GA4 or CRM | Headline number vs. last period and last year | By landing page |
| Organic sessions and engagement | GA4 | Monthly trend | By landing page, device, country |
| Clicks, impressions, CTR | Search Console | Trend with year-over-year | By query, page, search appearance |
| Average position | Search Console | Context only | By query group and page |
| Priority keyword rankings | Rank tracker | 10 to 20 business-critical terms | Full set, biggest movers |
| Top and declining pages | Search Console, GA4 | Top five | Winners, losers, new pages |
| Indexing and Core Web Vitals | Search Console, crawler | Only when something is wrong | Every report |
| Backlinks | Ahrefs, Semrush or similar | New referring domains, one line | New and lost links |
Keep the client page to five to seven numbers plus a short commentary box at the top, where it’s the first thing people read. Everything else can go on later pages or in the live dashboard.
How to create automated SEO reports for your clients (step by step)
These steps use Data Studio because it’s free and connects natively to Search Console and GA4. Paid tools follow the same sequence with different menus.

Step 1: Connect Search Console, GA4 and your rank tracker
- Search Console: add the Search Console connector. The Site Impression table aggregates by property; the URL Impression table gives page-level data. A data source can use only one, so add both if you need property totals and page tables in one report.
- GA4: add the Google Analytics connector and filter charts to the Organic Search channel.
- Rank tracker: use its Data Studio connector if it has one. If not, a scheduled export to Google Sheets works, since Data Studio reads Sheets natively.
Connect everything through an agency-owned Google account with access to each client property. If the person whose login powers a data source leaves, the charts break.
Step 2: Build or copy a template
Building a solid SEO report from a blank canvas takes hours. Copying a template and swapping in your data sources takes minutes. Our Search Console template covers queries, landing pages, devices, countries and trends, with branded vs. non-branded filters built in. The Ultimate Website Dashboard puts GA4, Search Console and Google Ads in one report, and the full template library covers other channels. If you’d rather build your own, see our guides to Search Console dashboards and GA4 dashboards.
Step 3: Set filters and date comparisons once
A scheduled report only stays correct if the dates move by themselves. Set these at report level:
- Date range: a rolling range such as “Last month” for monthly reports or “Last 7 days” for weekly ones. Never fixed dates.
- Comparisons: “Previous period” on scorecards and “Previous year” on trend charts. Year-over-year strips out most seasonality.
- Filters: exclude branded queries with a regex filter, and exclude blank query rows in Search Console tables (those are anonymized queries, covered below).
- Multiple sites: a data control lets one internal template switch between Search Console properties. For client delivery, keep one copy per client (see the next step).
Step 4: Schedule email delivery
Open the report, click Share, then Schedule delivery. Choose recipients, pages, a start date and time, and a repeat frequency, including custom patterns such as every two weeks. Worth knowing before you rely on it:
- Each email carries a PDF of the selected pages, a preview of up to five pages and a link to the live report.
- You can add up to 50 recipients, and you’re always one of them.
- You need to be the owner, an editor, or have scheduling permission.
- Without Data Studio Pro, each report gets one schedule, sent at most once a day. Pro allows up to 200 schedules per report, hourly sends, Send now, and delivery to Google Chat.
- Send times follow your computer’s time zone, which you can’t change inside Data Studio.
Because the free tier allows one schedule per report, give each client their own copy. And schedule monthly sends a few days into the month: Search Console’s newest data is preliminary and can still change. Our Data Studio Pro guide covers what else Pro adds.
Step 5: Add a commentary step
This is the step most automated reports skip, and it’s the part clients value. Add a text box at the top of page one with three lines: what changed (the one or two movements that matter), why (a page update, a Google algorithm update, seasonality, a tracking change), and what’s next (your actions before the next report).
Put a recurring reminder on the calendar a day or two before each send and name an owner. Some paid tools build the step in: AgencyAnalytics offers report approval on select plans, and Whatagraph can hold a report until someone reviews it. AI summaries can draft the text, but check every number they quote. Our post on Data Studio’s AI features covers what they can do.
Step 6: Test it, then check it monthly
Send the first run to yourself only. Look for blank charts, cut-off tables, errors and wrong date ranges in the PDF. After that, spend five minutes a month confirming every data source still connects, last month’s email went out, and the totals roughly match Search Console itself.
Automated SEO monitoring vs. automated SEO reporting
Reporting looks back over a fixed period and goes out on a schedule. Monitoring watches continuously and speaks up only when something crosses a threshold. A monthly report tells you traffic fell last month; an alert tells you on day two. You want both.
| What to watch | Free options | Paid options |
|---|---|---|
| Traffic or conversion drops | GA4 custom insights: a percentage-change or “has anomaly” condition, checked hourly (web only), daily, weekly or monthly, with email alerts; up to 50 per property | Data Studio Pro chart alerts; KPI goal notifications in AgencyAnalytics |
| Indexing and site issues | Search Console emails site owners about important events, and again when a fix you asked it to validate passes or fails | Ahrefs Site Audit alerts |
| Ranking changes | No native alert; check Search Console’s 24-hour view | Semrush Position Tracking triggers (up to 10 per campaign); Ahrefs Rank Tracker and new keyword alerts |
| Backlinks | Search Console Links report, checked manually | Ahrefs new and lost backlink alerts |
Set thresholds high enough that an alert means “look now”, or people learn to ignore them, and route each alert to whoever will act on it. Two limits to know: Data Studio Pro alerts can only go to addresses inside your organization, and Semrush triggers email only the Semrush account holder. Both suit internal monitoring rather than client notifications.
Reporting cadence: weekly, monthly or real-time?
- Monthly is the default for clients and executives. SEO changes take weeks to show, and months line up with budgets and invoices.
- Weekly suits the SEO team and risky periods such as a migration, redesign or large content launch.
- Quarterly is for strategy: year-over-year trends, what worked and what to change.
- Real-time is a dashboard question, and it’s never truly live. In Data Studio, Search Console data refreshes every 12 hours (fixed), and GA4 every 12 hours by default or every 1 or 4 hours if you change it. Search Console’s 24-hour view runs a few hours behind. That’s enough to catch a launch going wrong, not to watch every click.
Tools for automated SEO reporting
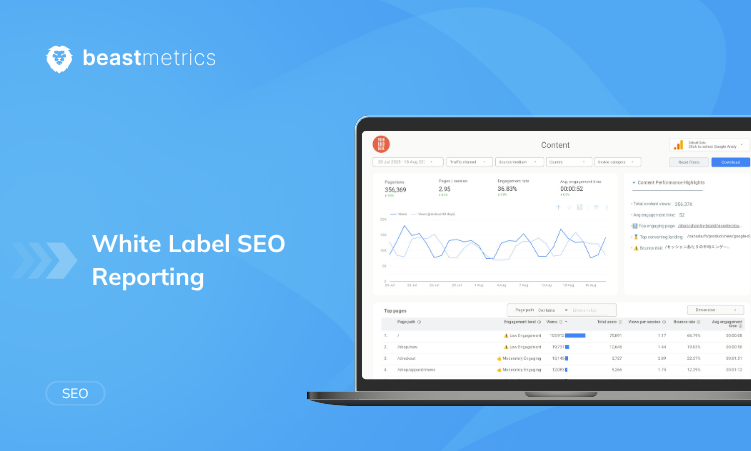
This list focuses on automation: scheduling, alerts and data connections. For branding, client portals and a fuller comparison, see our guide to white label SEO reporting tools.
Data Studio (formerly Looker Studio)
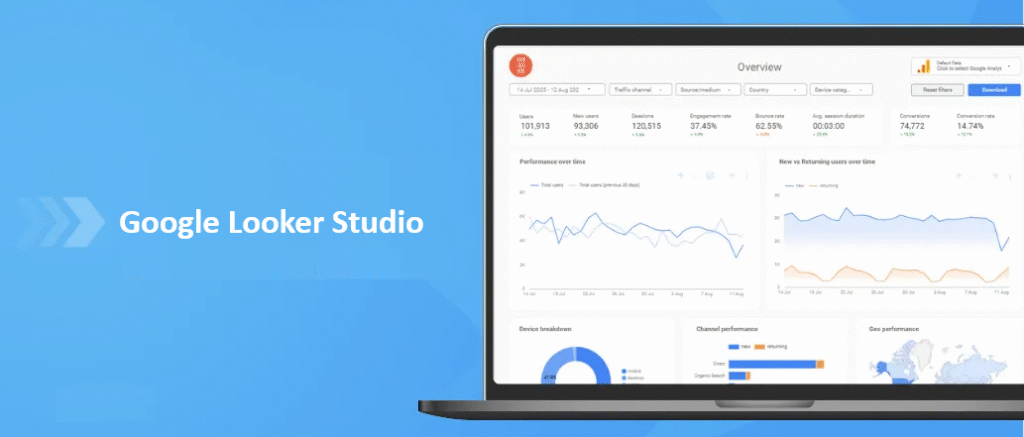
Google’s free reporting tool, renamed from Looker Studio back to Data Studio in April 2026; existing reports and links carried over. It connects natively to Search Console and GA4 and schedules PDF emails. Pro adds hourly schedules, Google Chat delivery and chart alerts. Best for: Google-first SEO reporting on a small budget, especially starting from a template.
Whatagraph
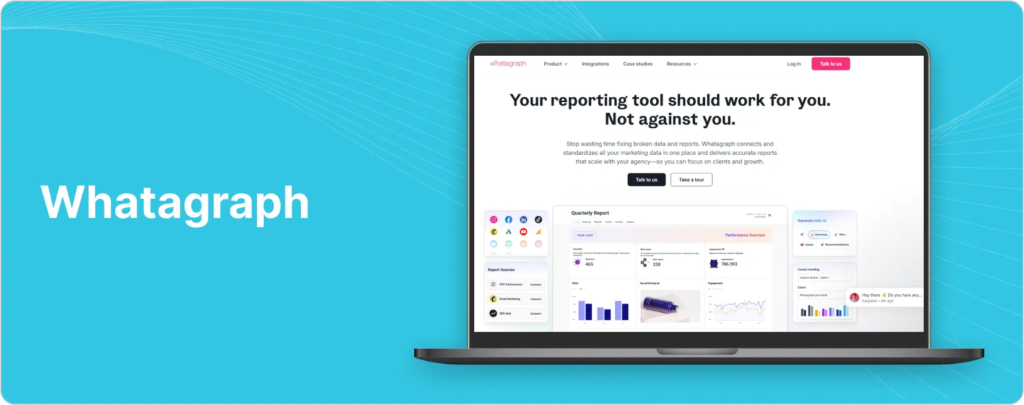
Automation settings cover sending frequency, delivery day, time and time zone. You can send automatically, review first, or hold reports until data issues are reviewed. Best for: agencies reporting across many channels, not just SEO.
AgencyAnalytics
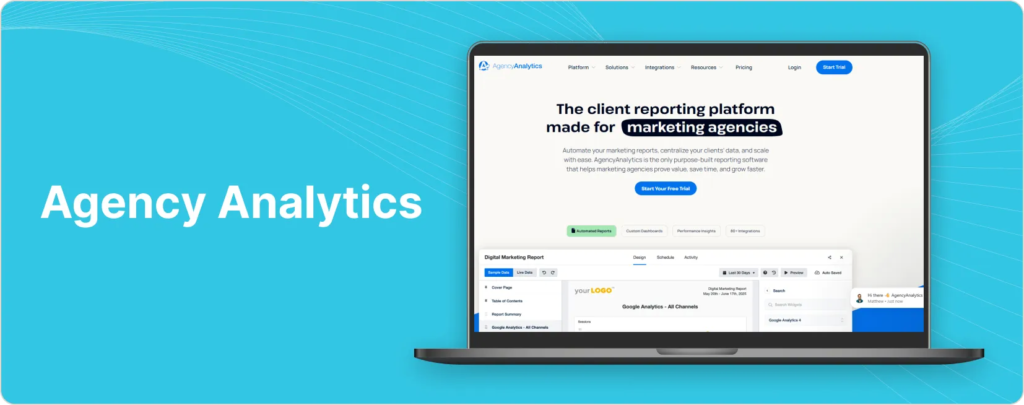
Schedules reports for a date and time you choose and delivers them by email, PDF or shareable link, with report approval on select plans. KPI goals post an in-app notification when a target is met or a metric moves enough to be worth a look. Best for: agencies that want one client-facing platform across channels.
Semrush
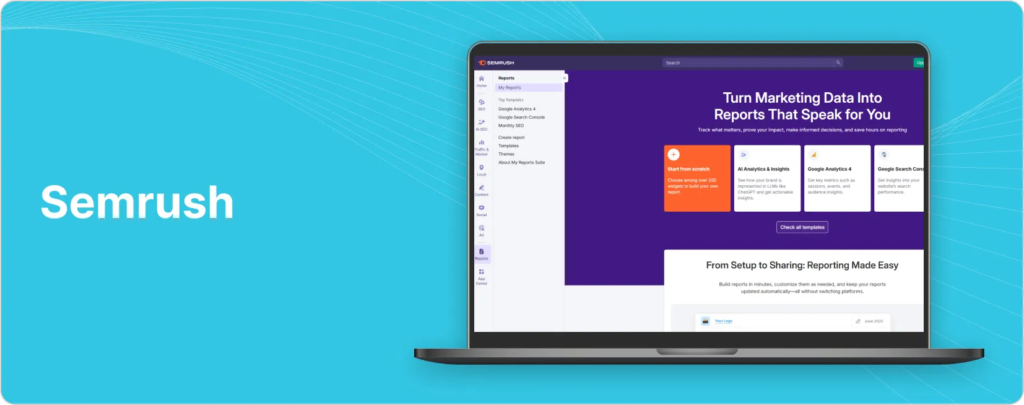
Reports from Semrush tools such as Position Tracking and Organic Research can be scheduled as PDFs daily, weekly or monthly, and My Reports combines widgets from several tools. Position Tracking triggers flag big ranking moves. Best for: teams that already track rankings in Semrush.
Ahrefs
Ahrefs email alerts cover new and lost backlinks, new keywords and web mentions, plus Rank Tracker and Site Audit. Frequency options depend on the feature and plan. Best for: monitoring links and rankings between scheduled reports.
Common pitfalls with automated SEO reports
GA4 quota errors
Data Studio reports built on GA4 are subject to the Google Analytics Data API quotas, and a report that exceeds them can show an error instead of a chart. For a standard property the core limits are 200,000 tokens per property per day, 40,000 per hour, 14,000 per project per property per hour, and 10 concurrent requests (Analytics 360 limits are ten times higher, with 50 concurrent requests). Every chart sends its own requests, so a busy report opened by several people at once can hit the limits. Use fewer charts per page, keep the default 12-hour data freshness, and for heavy reports load GA4 data into Google Sheets or BigQuery first.
GA4 sampling and thresholds
GA4 samples data when a report or request needs more events than the property’s limit (10 million events for standard properties). It also applies data thresholds, which hide rows involving demographic data or search terms with too few users, and you can’t adjust them. In client reports, drop demographic breakdowns you don’t need and use wider date ranges for small segments.
Search Console lag, anonymized queries and row limits
- Lag: the newest data is preliminary and can change, which is why monthly sends should wait a few days.
- Anonymized queries: queries not issued by more than a few dozen users over two to three months are hidden for privacy. They’re left out of query tables but included in chart totals, so table rows won’t add up to the total. Note this in the report before a client asks.
- Row limits: the Search Console interface exports up to 1,000 rows; the API and the Data Studio connector top out at 50,000 rows per day, per site, per search type (source: Google Search Central). Very large sites lose part of the long tail.
- 16 months of history: the Performance report keeps 16 months of data. For longer year-over-year history, turn on the bulk data export to BigQuery, a daily export of your performance data (minus anonymized queries).
Attribution and mismatched numbers
Search Console clicks and GA4 organic sessions measure different things, so they won’t match. Pick one source of truth per metric and label it on the page. AI search adds a wrinkle: Google counts appearances in AI Overviews and AI Mode within the Web search type in Search Console, not as a separate line, so you can’t isolate that traffic there.
Reporting on autopilot
The most common failure isn’t technical: it’s a 40-chart report with no explanation, or one that kept going out for months with a broken connector. Keep the client page short, keep the commentary step, and review the metric list each quarter.
Setup checklist
- Connect Search Console, GA4 and your rank tracker through an agency-owned account.
- Copy a template and cut the client page to five to seven KPIs.
- Set rolling date ranges, period and year-over-year comparisons, and branded-query filters.
- Schedule delivery a few days after month end, one report copy per client.
- Add a commentary reminder before every send.
- Set alerts for traffic drops, indexing issues and ranking changes, routed to your team.
- Check connectors and delivery once a month.