Key Highlights
• Automate weekly SEO reports with zero manual work
• Segment branded traffic from true SEO growth metrics
• Include conversion data to prove SEO ROI clearly
• White-label dashboards for professional client presentations
• Connect multiple data sources in single view
Introduction
“Transform messy Search Console data into client-ready reports in minutes.”
Monday morning. Your boss walks in and asks, “How’s our SEO performing?” You frantically open Google Search Console, export CSV files, and spend the next hour trying to make sense of scattered data points. Meanwhile, that important campaign analysis gets pushed to tomorrow, again.
I’ve been in this exact situation more times than I care to admit. After years of building custom SEO reports for agencies and in-house teams, I’ve learned that the difference between good marketers and great ones isn’t just strategy, it’s how quickly they can turn data into actionable insights.
A Google Search Console dashboard solves this problem by automatically pulling your search performance data into a visual, easy-to-understand format. Instead of wrestling with spreadsheets, you get real-time insights that impress stakeholders and actually help you make better decisions. In this guide, I’ll show you exactly how to build one, what metrics matter most, and how to avoid the common mistakes that make most SEO reports useless.
What Is a Google Search Console Dashboard and Why You Need One
A Google Search Console dashboard is a customized visual report that connects directly to your Search Console data, displaying key metrics like clicks, impressions, click-through rates, and average positions in charts and graphs that update automatically.
Think of it as the difference between getting a pile of receipts versus a formatted expense report. Both contain the same information, but only one helps you actually understand what’s happening and make decisions.
The Problem with Manual SEO Reporting
Most marketers waste 2-3 hours every week manually pulling Search Console data into spreadsheets. You export CSV files, clean up the formatting, create basic charts, and by the time you’re done, the insights are already a week old. Worse, these static reports can’t answer follow-up questions or show real-time changes.
Benefits of an Automated Search Console Dashboard
Time Savings: Once set up, your dashboard updates automatically with fresh data every day. No more Monday morning panic sessions.
Actionable Insights: Instead of staring at rows of numbers, you see trends, patterns, and opportunities at a glance. Spot CTR drops before they become traffic disasters.
Professional Presentation: Share a polished, interactive report that clients and stakeholders can explore themselves, rather than sending static PDF attachments.
Historical Context: Track performance over time with visual trend lines that show whether that traffic spike was a one-time event or part of a growing pattern.
The marketers I work with typically save 4-6 hours per week after implementing automated dashboards, time they redirect toward strategy and optimization rather than data compilation.
Essential Metrics for Your Search Console Dashboard
Your dashboard is only as valuable as the metrics you choose to include. After analyzing hundreds of SEO reports, I’ve identified the core components that actually drive decision-making.
Traffic and Visibility Metrics
Total Clicks and Impressions Over Time: Your primary pulse check. Include period-over-period comparisons (month-over-month, year-over-year) to quickly spot growth or decline trends.
Click-Through Rate (CTR): Often overlooked but critical for identifying optimization opportunities. High impression queries with low CTR indicate meta description or title tag problems you can fix quickly.
Average Position Trends: Shows whether your ranking improvements are translating to traffic gains. Position improvements should eventually drive more clicks, if they don’t, investigate why.
Content and Keyword Performance
Top Performing Queries: Your highest-traffic search terms, but segment these by branded vs non-branded searches. Branded traffic growth might indicate successful PR campaigns rather than SEO wins.
Top Landing Pages: Identify your SEO MVPs and ensure these pages stay optimized. Also spot pages that should perform better but aren’t getting expected traffic.
Query Opportunity Analysis: Queries with high impressions but low clicks represent quick wins. These often need better meta descriptions or title tag optimization.
Technical and User Experience Metrics
Device Performance Breakdown: Mobile vs desktop traffic patterns inform technical priorities. If 70% of your traffic comes from mobile, mobile page speed becomes crucial.
Geographic Performance: Unexpected traffic from certain regions might reveal new market opportunities or indicate technical issues affecting local performance.
Index Coverage Summary: A high-level view of crawling and indexing health. Include metrics like “Pages Indexed vs Pages with Errors” as an early warning system.
Business Impact Metrics (The Missing Piece)
Here’s where most SEO dashboards fail: they don’t connect search performance to business outcomes.
Organic Conversions: Pull Google Analytics 4 data to show how many leads, sales, or goal completions came from organic search. This transforms your dashboard from a traffic report into a revenue driver.
Conversion Rate by Landing Page: Some pages drive traffic but don’t convert. Others have lower traffic but higher value visitors. This metric helps prioritize optimization efforts.
Customer Lifetime Value Attribution: For e-commerce sites, track which organic keywords and pages bring the highest-value customers over time.
Step-by-Step Guide: Building Your Search Console Dashboard
Creating an effective dashboard requires the right approach and tools. I’ll walk you through both the manual method using free tools and the faster template-based approach.
Step 1: Choose Your Dashboard Platform
Google Looker Studio (Free): My recommended starting point. It connects natively to Search Console and offers robust visualization options. Perfect for most businesses and agencies.
Alternative Tools: Databox, Geckoboard, and similar platforms offer additional features like automated email reports and advanced sharing options, but typically require monthly subscriptions.
Template Solutions: Pre-built dashboard templates can save 10+ hours of setup time. More on this approach later.
Step 2: Connect Your Data Sources
In Looker Studio, create a new report and add Google Search Console as your data source. You’ll need to authenticate and select whether you want site-level or page-level data (I recommend starting with site-level for overview dashboards).
Pro Tip: Also connect Google Analytics 4 to pull conversion data alongside search performance. This integration separates amateur reports from professional analyses.
Step 3: Design Your Dashboard Layout
Page 1 – Executive Overview: High-level metrics for stakeholders who want the big picture in 30 seconds.
- Total clicks, impressions, CTR, and average position (current period vs previous period)
- Traffic trend line over the last 12 months
- Top 10 performing queries and pages
- Conversion summary from organic traffic
Page 2 – Keyword Intelligence: Deep dive for SEO specialists and content creators.
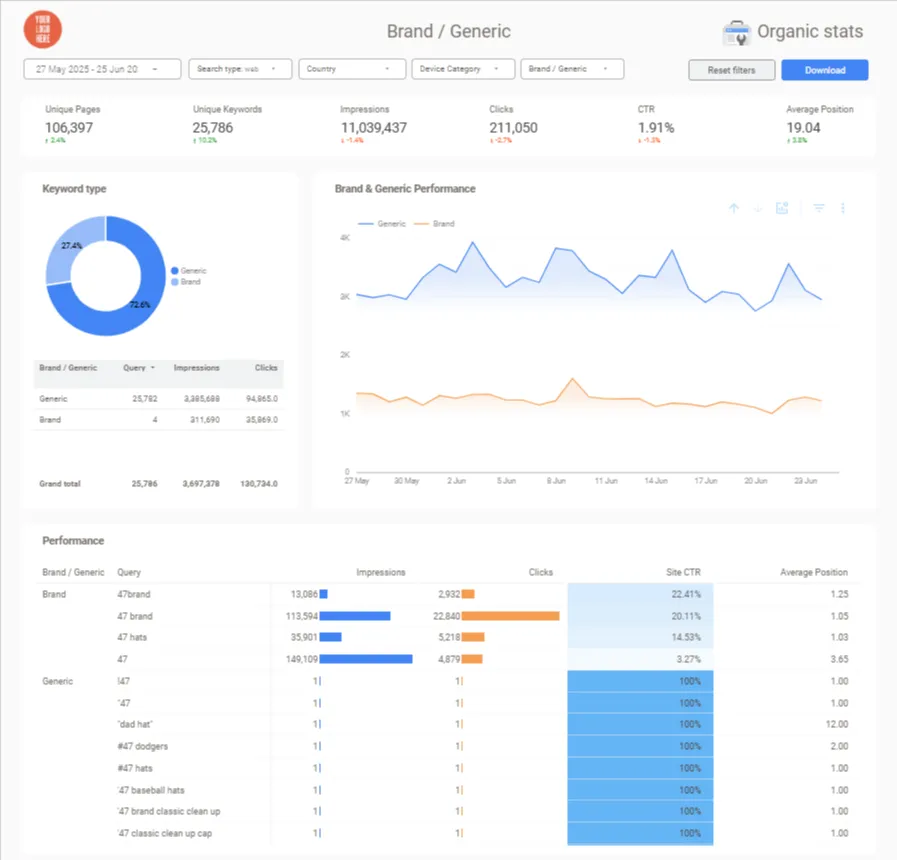
- Branded vs non-branded query performance
- Opportunity queries (high impressions, low CTR)
- Position distribution chart showing how many keywords rank in different position ranges
- Query performance by device and location
Page 3 – Technical Health: Early warning system for technical issues.
- Index coverage trends
- Core Web Vitals summary (if available)
- Mobile usability issues
- Page experience metrics
Step 4: Implement Advanced Segmentation
Branded vs Non-Branded Traffic: Create filters that separate searches containing your brand name from purely organic discovery queries. Non-branded growth indicates true SEO success.
Content Category Breakdown: If your site has distinct sections (blog, products, resources), segment performance by URL patterns or page categories.
Seasonal Adjustments: Include year-over-year comparisons to account for seasonal business fluctuations.
Step 5: Automate Updates and Sharing
Configure automatic data refresh (Looker Studio updates daily by default) and set up scheduled email reports for weekly or monthly stakeholder updates.
Client Presentation Tips: Add your branding (logo, colors) and include brief annotations explaining significant changes or trends. A dashboard with context tells a story; raw data just creates confusion.
Pro Tips for Outstanding SEO Dashboards
After building hundreds of these dashboards, I’ve learned which details separate amateur efforts from professional analyses.
Keep It Simple and Focused
Resist the urge to include every possible metric. Identify the 3-4 KPIs that align with your specific goals (lead generation, e-commerce sales, brand awareness) and build around those.
Content Sites: Focus on impressions, engagement metrics, and content performance.
E-commerce Sites: Prioritize conversion-driving queries and product page performance.
Local Businesses: Emphasize location-based performance and “near me” query trends.
Use Narrative and Context
Include text boxes or annotations that explain what the numbers mean. For example: “Clicks increased 35% month-over-month, primarily driven by our new product launch content in August.”
This context transforms your dashboard from a data dump into a strategic communication tool.
Leverage Google’s Tool Limitations
Search Console data has a 2-day delay and samples very broad queries. Set expectations appropriately and explain why minor discrepancies between different tools are normal.
For deeper analysis beyond Search Console’s 1,000-row limit, mention that advanced users might export data to BigQuery, but emphasize that standard dashboards serve most business needs effectively.
Optimize for Different Audiences
For Executives: Focus on business impact metrics and high-level trends.
For Marketing Teams: Include actionable insights like optimization opportunities and performance attribution.
For Clients: Emphasize progress toward stated goals and include competitive context where possible.
The Template Advantage
Building dashboards from scratch requires significant time investment and technical knowledge. After creating dozens of custom solutions, I developed standardized templates that include all the essential components discussed above.
These templates connect to your Search Console account and populate automatically with your data, eliminating 10+ hours of setup work while ensuring you don’t miss critical metrics or best practices.
Common Dashboard Mistakes to Avoid
Mistake 1: Focusing Only on Vanity Metrics
Impressions and clicks look impressive but don’t always correlate with business results. Always include conversion or engagement metrics that tie back to your actual goals.
Mistake 2: Ignoring Mobile Performance
Mobile traffic typically represents 60-70% of search volume. If your dashboard doesn’t clearly show mobile vs desktop performance, you’re missing critical optimization opportunities.
Mistake 3: Missing Historical Context
Showing only current period data without historical comparison makes it impossible to identify trends or measure progress. Always include period-over-period analysis.
Mistake 4: Overcomplicating the Design
Dashboards should answer questions, not create them. If stakeholders need training to understand your dashboard, it’s too complex.
Advanced Integration Strategies
Multi-Platform Reporting
Combine Search Console data with other marketing channels for comprehensive performance analysis. Show how organic search performance correlates with paid advertising, social media, or email marketing efforts.
Competitive Intelligence
While Search Console doesn’t provide competitive data directly, you can benchmark your performance against industry standards or historical performance to provide context.
AI-Powered Insights
Modern dashboard tools can generate automated insights and anomaly detection. When your CTR drops unexpectedly or a new query starts driving significant traffic, automated alerts help you respond quickly.
Conclusion
An effective Google Search Console dashboard transforms SEO from a mysterious black box into a transparent, measurable business driver. By combining search performance data with business outcomes, you create reports that stakeholders actually understand and value.
The key is focusing on metrics that drive decisions rather than impressive-looking vanity numbers. Include conversion data, segments branded from organic traffic, and always provide context for the trends you’re showing.
Ready to skip the manual setup and get a professional dashboard instantly? Check out our google data studio search console template that includes all the best practices from this guide. It connects to your data automatically and provides the polished, client-ready presentation your SEO reporting deserves.
Building effective dashboards shouldn’t take weeks of technical work. With the right approach, and the right tools, you can transform your SEO reporting from a dreaded chore into a competitive advantage.