Key Highlights
- Transform scattered keyword data into automated reports that update daily without manual work
- Build professional search engine ranking reports using free Google tools in under 60 minutes
- Track the metrics that matter: position changes, SERP features, and business impact—not vanity numbers
- Discover why the top 3 search positions capture 68.7% of all clicks and how to get there
- Learn the 5 essential components every keyword rankings and visibility report needs
Introduction
“Stop drowning in spreadsheets and conflicting data—learn how to build a search engine ranking report that automatically tracks your keyword positions, reveals competitor movements, and proves your SEO value in minutes, not hours.
It was 4 PM on a Friday when my phone buzzed with that dreaded client text: “Can you send over our keyword ranking reports for Q3?”
I opened three different tabs—Google Search Console, a rank tracking tool, and my messy spreadsheet. Each showed different numbers. I had no idea which data to trust.
That’s when I realized I needed a systematic search engine ranking report—one that would automatically pull accurate data, visualize trends clearly, and give me back my weekends. If you’ve ever scrambled to compile ranking data or struggled to show clients the real value of your SEO work, this guide is for you.
Automate your search engine ranking report using Google Search Console and Looker Studio to track keyword positions, SERP features, and business impact in minutes — eliminating spreadsheets and conflicting data.
Why Search Engine Ranking Reports Matter (Beyond Just Rankings)
Here’s what I’ve learned after building dozens of search ranking reports: nobody cares that you rank #5 for “organic dog treats.” They care about what that ranking means for their business.
According to First Page Sage’s 2025 click-through rate study, the top three organic search results receive more than two-thirds (68.7%) of all clicks on Google Search pages, with the #1 position alone capturing 39.8% of clicks. When you tell a client they’ve moved from position 12 to position 4, you’re telling them they’ve entered the zone where real traffic happens.
How Keyword Ranking Reports Drive SEO Strategy
A proper keyword ranking report reveals patterns that simple position numbers miss:
- Early Warning System: When multiple keywords decline simultaneously in your SERP ranking report, it often signals an algorithm update or competitor movement before you see traffic drops. Monitoring these patterns helps you respond proactively rather than reactively.
- Quick Win Identification: Keywords at positions 4-10 represent your lowest-hanging fruit. Research shows that position 4 generates approximately 7-8% CTR while positions 9-10 typically generate clicks under 2%. A focused push can move them into double-digit CTR territory.
- Client Retention Tool: Nothing builds confidence like showing rankings steadily climbing over six months in your keyword rankings and visibility report. Studies indicate that 91% of organizations reported that SEO positively impacted website performance and marketing goals in 2024—but only when data was presented clearly through effective reporting.
- Content Strategy Direction: When certain keyword groups consistently outperform others in your search engine ranking report, you’ve found your content sweet spot.
Common Mistakes That Waste Everyone’s Time
Before diving into building automated ranking reports, avoid these mistakes:
Tracking Too Many Irrelevant Keywords: Focus on keywords that matter to your business goals, not vanity metrics.
Ignoring the “Why”: Position changes need context. Did you drop because a competitor launched an amazing guide, or because Google’s algorithm shifted?
Missing Device Differences: A client once celebrated ranking #2 on desktop, not realizing they were #15 on mobile—where 70% of traffic came from. Always segment your search ranking report data.
Search Engine Ranking Report Template: What to Include
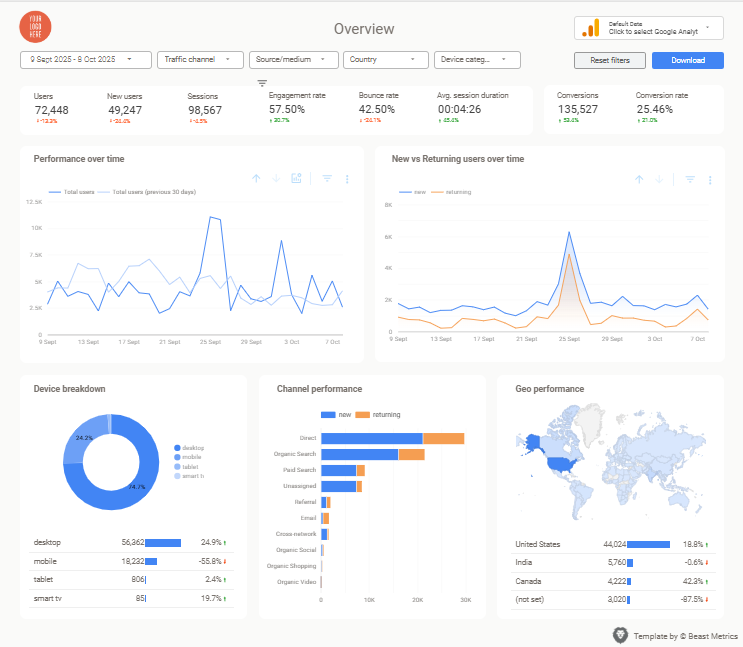
The most effective keyword ranking reports include five core sections:
1. Keyword Performance Overview: The Pulse Check
Every effective search engine ranking report starts with improved and declined keywords—answering “Who went up and who went down this period?”
This table should show:
- Keyword name and current position
- Previous position and change (color-coded: green for gains, red for losses)
- Estimated monthly search volume
- The URL currently ranking
Why it matters: This is where clients look first in your SERP ranking report. It gives conversation starters and helps prioritize optimization work.
2. Rank Distribution Chart: Your SEO Scoreboard
This pulse check shows how many keywords sit in positions 1-3, 4-10, 11-20, and beyond. I visualize this as a column chart—it’s become my favorite metric in any keyword rankings and visibility report.
When your “positions 4-10” column grows while “positions 1-3” stays flat, you’re building momentum but haven’t broken through yet.
3. Brand vs Generic Performance: The Authority Indicator
Comparing branded keyword performance against generic terms in your search ranking report reveals whether you’re building genuine market authority or just benefiting from name recognition.
4. SERP Features Snapshot: Beyond the Blue Links
Modern keyword ranking reports must track SERP features like featured snippets, local packs, and People Also Ask boxes. According to Ahrefs’ comprehensive study on SERP features, featured snippets can increase click-through rates by up to 114% compared to traditional listings.
Track how many keywords trigger featured snippets, local packs, image packs, and video carousels in your SERP ranking report.
5. Traffic and Business Impact Correlation
The most sophisticated search engine ranking reports connect ranking changes to actual business metrics. When you show that moving from #8 to #3 generated 47 additional demo requests worth $180,000 in pipeline, you’ve transcended from SEO report to revenue report.
How to Create a Search Engine Ranking Report in Looker Studio (Step-by-Step)
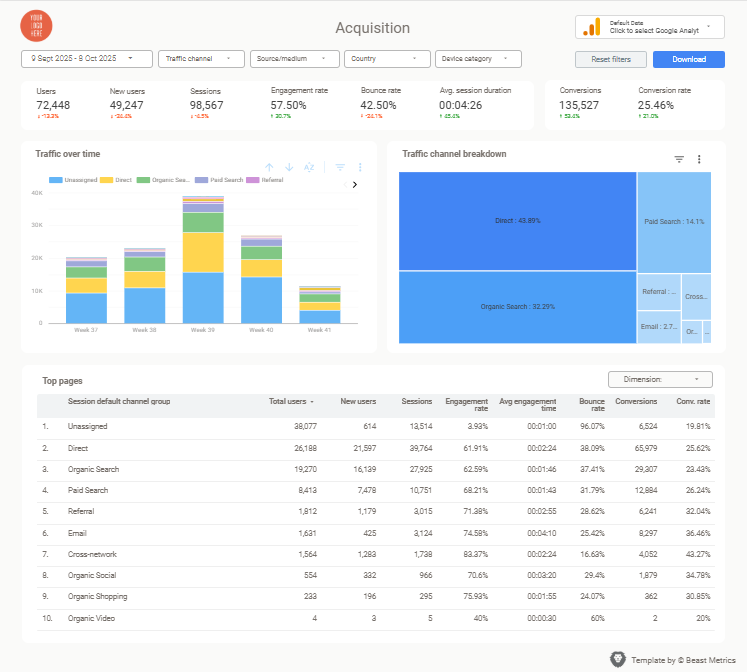
Now for the practical part—actually building your Looker Studio SEO report using free tools that deliver professional results.
Step 1: Define Your Keyword Universe (15 minutes)
Start by identifying 20-50 keywords that matter for your automated ranking reports:
- 5-10 primary keywords (high-volume, high-commercial-intent terms)
- 10-20 secondary keywords (supporting terms in your topic cluster)
- 5-10 branded keywords (your company name and variations)
- 5-10 competitor keywords (terms where competitors dominate)
Every keyword should have a clear reason for inclusion in your search ranking report.
Step 2: How to Track Keyword Rankings Automatically with Google Search Console
Google Search Console provides the gold standard data source for automated ranking reports—and it’s completely free.
The connection process:
- Open Looker Studio (formerly Google Data Studio)
- Click “Create” → “Data Source”
- Select “Search Console” from the connector list
- Choose “Site Impression” mode for keyword-level data
- Authorize access to your property
- Select your website from the dropdown
You’ve created a live pipeline for automated ranking reports. Every time you open your report, it automatically pulls fresh data. Google’s official Search Console documentation provides additional guidance on interpreting your data correctly.
Step 3: Build Your Keyword Ranking Dashboard (30 minutes)
Create charts and tables that bring your search engine ranking report to life. Using a template from an SEO reporting dashboard can save hours of work—industry research shows agencies are cutting reporting time from hours to just 15 minutes per client using pre-built templates.
Creating the Keyword Performance Table:
- Add a new table to your report
- Set dimensions to “Query” (keyword) and “Landing Page”
- Add metrics: “Average Position,” “Impressions,” “Clicks”
- Apply filters to exclude branded terms if desired
- Sort by “Clicks” descending
Building the Rank Distribution Chart:
Use a CASE formula to bucket positions into ranges for your keyword rankings and visibility report:
CASE
WHEN Average Position <= 3 THEN “Positions 1-3”
WHEN Average Position <= 10 THEN “Positions 4-10”
WHEN Average Position <= 20 THEN “Positions 11-20”
ELSE “Beyond 20”
END
Step 4: Add Context with Filters and Date Controls (10 minutes)
Filters add depth to your SERP ranking report:
- Date range selector (default: last 28 days vs previous 28 days)
- Device filter (mobile vs desktop vs tablet)
- Landing page filter (isolate performance by content type)
These controls transform a static search ranking report into an analytical tool.
Step 5: Schedule Automatic Updates (5 minutes)
Set your Looker Studio report to:
- Auto-refresh data daily
- Send scheduled email snapshots weekly or monthly
- Share with stakeholders via a view-only link
My Friday afternoon panic? Never happened again after setting up automated ranking reports. Clients get fresh keyword ranking reports links every Monday without me lifting a finger.
Best Tools for Automated Keyword Ranking Reports (Free & Paid)
The Free, Powerful Core: Google Search Console + Looker Studio
For most cases, Google Search Console combined with Looker Studio provides everything needed for professional search engine ranking reports. The data comes directly from Google (accurate), updates automatically, and it’s free.
When this approach works best:
- Tracking fewer than 100 keywords in your search ranking report
- Don’t need hyper-local ranking data
- Comfortable with 7-day average positions
- Want to save budget for other initiatives
The main limitation? GSC data is averaged over time and limited to the last 16 months. For long-term tracking in your keyword rankings and visibility report, export data regularly.
SEO Ranking Report Tools Comparison
Here’s a quick comparison of the most popular tools for building keyword ranking reports:
| Tool | Best For | Price Range | Key Feature | Data Source |
|---|---|---|---|---|
| Google Search Console + Looker Studio | Small businesses, agencies starting out | Free | Native Google integration, accurate data | Google’s servers |
| SEMrush | Competitor analysis, keyword research | $129.95+/month | 25+ billion keywords database | Third-party tracking |
| Ahrefs | Backlink analysis, content research | $99+/month | Site Explorer, Content Gap tool | Third-party tracking |
| AccuRanker | Daily rank tracking, local SEO | $116+/month | On-demand ranking updates | Third-party tracking |
| Moz Pro | All-in-one SEO suite | $99+/month | Domain Authority metric | Third-party tracking |
When to Consider Paid Rank Trackers
Tools like SEMrush, Ahrefs, and AccuRanker make sense when you need daily position checks, local ranking variations, or competitor tracking for comprehensive SERP ranking reports.
These tools don’t replace Google Search Console in your search engine ranking report—they complement it. Use GSC as your source of truth and paid tools for competitive intelligence.
If you’re managing SEO across multiple channels, learning how to build comprehensive marketing dashboards can help you integrate your ranking data with broader campaign performance.
SEO Ranking Report Template Options That Save Time
Having a pre-built framework eliminates 80% of the setup work for automated ranking reports. I used to spend 2-3 hours setting up each client’s keyword ranking reports. Now it takes 15 minutes to plug in their data source and customize branding.
For agencies managing multiple clients, exploring pre-built SEO dashboard templates can transform weeks of manual dashboard creation into minutes of setup time.
Common Ranking Report Mistakes and How to Fix Them
Mistake #1: Treating All Rankings Equally
The biggest trap is averaging rank across hundreds of irrelevant terms in your search ranking report. Segment by search volume or business value in your keyword rankings and visibility report. Create separate views for high-priority keywords versus long-tail keywords.
Mistake #2: Forgetting Data Limitations
Quality automated ranking reports use scheduled refresh cycles for data accuracy. GSC data can lag 2-3 days. Set expectations upfront for your SERP ranking report—track 7-day rolling averages to smooth out noise.
Mistake #3: Ignoring Mobile vs Desktop Split
Device breakdown is critical since mobile and desktop SERPs show different results. Always include device filtering in your keyword ranking reports. Google’s shift to mobile-first indexing means mobile rankings are now the primary signal for search visibility—making mobile tracking essential in every search engine ranking report.
Mistake #4: Creating Data Dumps Instead of Insights
The worst search ranking reports look like database exports. Every keyword rankings and visibility report should tell a story with executive summaries, conditional formatting, and action-oriented conclusions.
Conclusion: Transform Your SEO Reporting Today
Building effective search engine ranking reports doesn’t have to be complicated. By following this systematic approach—connecting Google Search Console to Looker Studio, focusing on actionable metrics, and automating data collection—you transform scattered ranking data into strategic intelligence that drives real results.
Start with 20-30 of your most important keywords, master the basics of rank distribution and trend tracking, then expand as you gain confidence. The goal isn’t to track every possible metric—it’s to build a reporting system that saves time, reveals insights, and proves your SEO value clearly.
Your ranking data is already out there. It’s time to turn it into automated ranking reports that work for you instead of against you. For marketers ready to take their reporting further, using a professional SEO reporting template creates a complete performance picture that covers rankings, traffic, technical health, and conversions in one unified view—eliminating the need to build dashboards from scratch.