

How to setup?
Key Questions This Template Answers
Local Visibility & Search Behavior
- How many impressions is your business receiving on Google Search and Maps?
- Which search terms are driving views and discovery?
- What’s your day-by-day visibility trend over time?
- How is your business performing compared to previous periods?
Customer Engagement & Action Tracking
- How many people clicked on your website, asked for directions, or made a call?
- On which days are customer actions highest or lowest?
- What’s your interaction breakdown by type and day of week?
- How is your GMB performance trending month-over-month?
Location & Multi-Outlet Management
- Which store locations receive the most interactions?
- How does performance vary by branch or territory?
- Are specific stores underperforming in engagement or visibility?
- Which areas show high action rates and which need optimization?
User Experience Signals
- How many reviews are submitted per location?
- What is your average GMB rating across all outlets?
- How does action rate compare to impressions?
- What’s the click-to-call vs direction request ratio?
5 Insight-Rich Dashboard Sections Included
📊 Overview & Engagement Summary
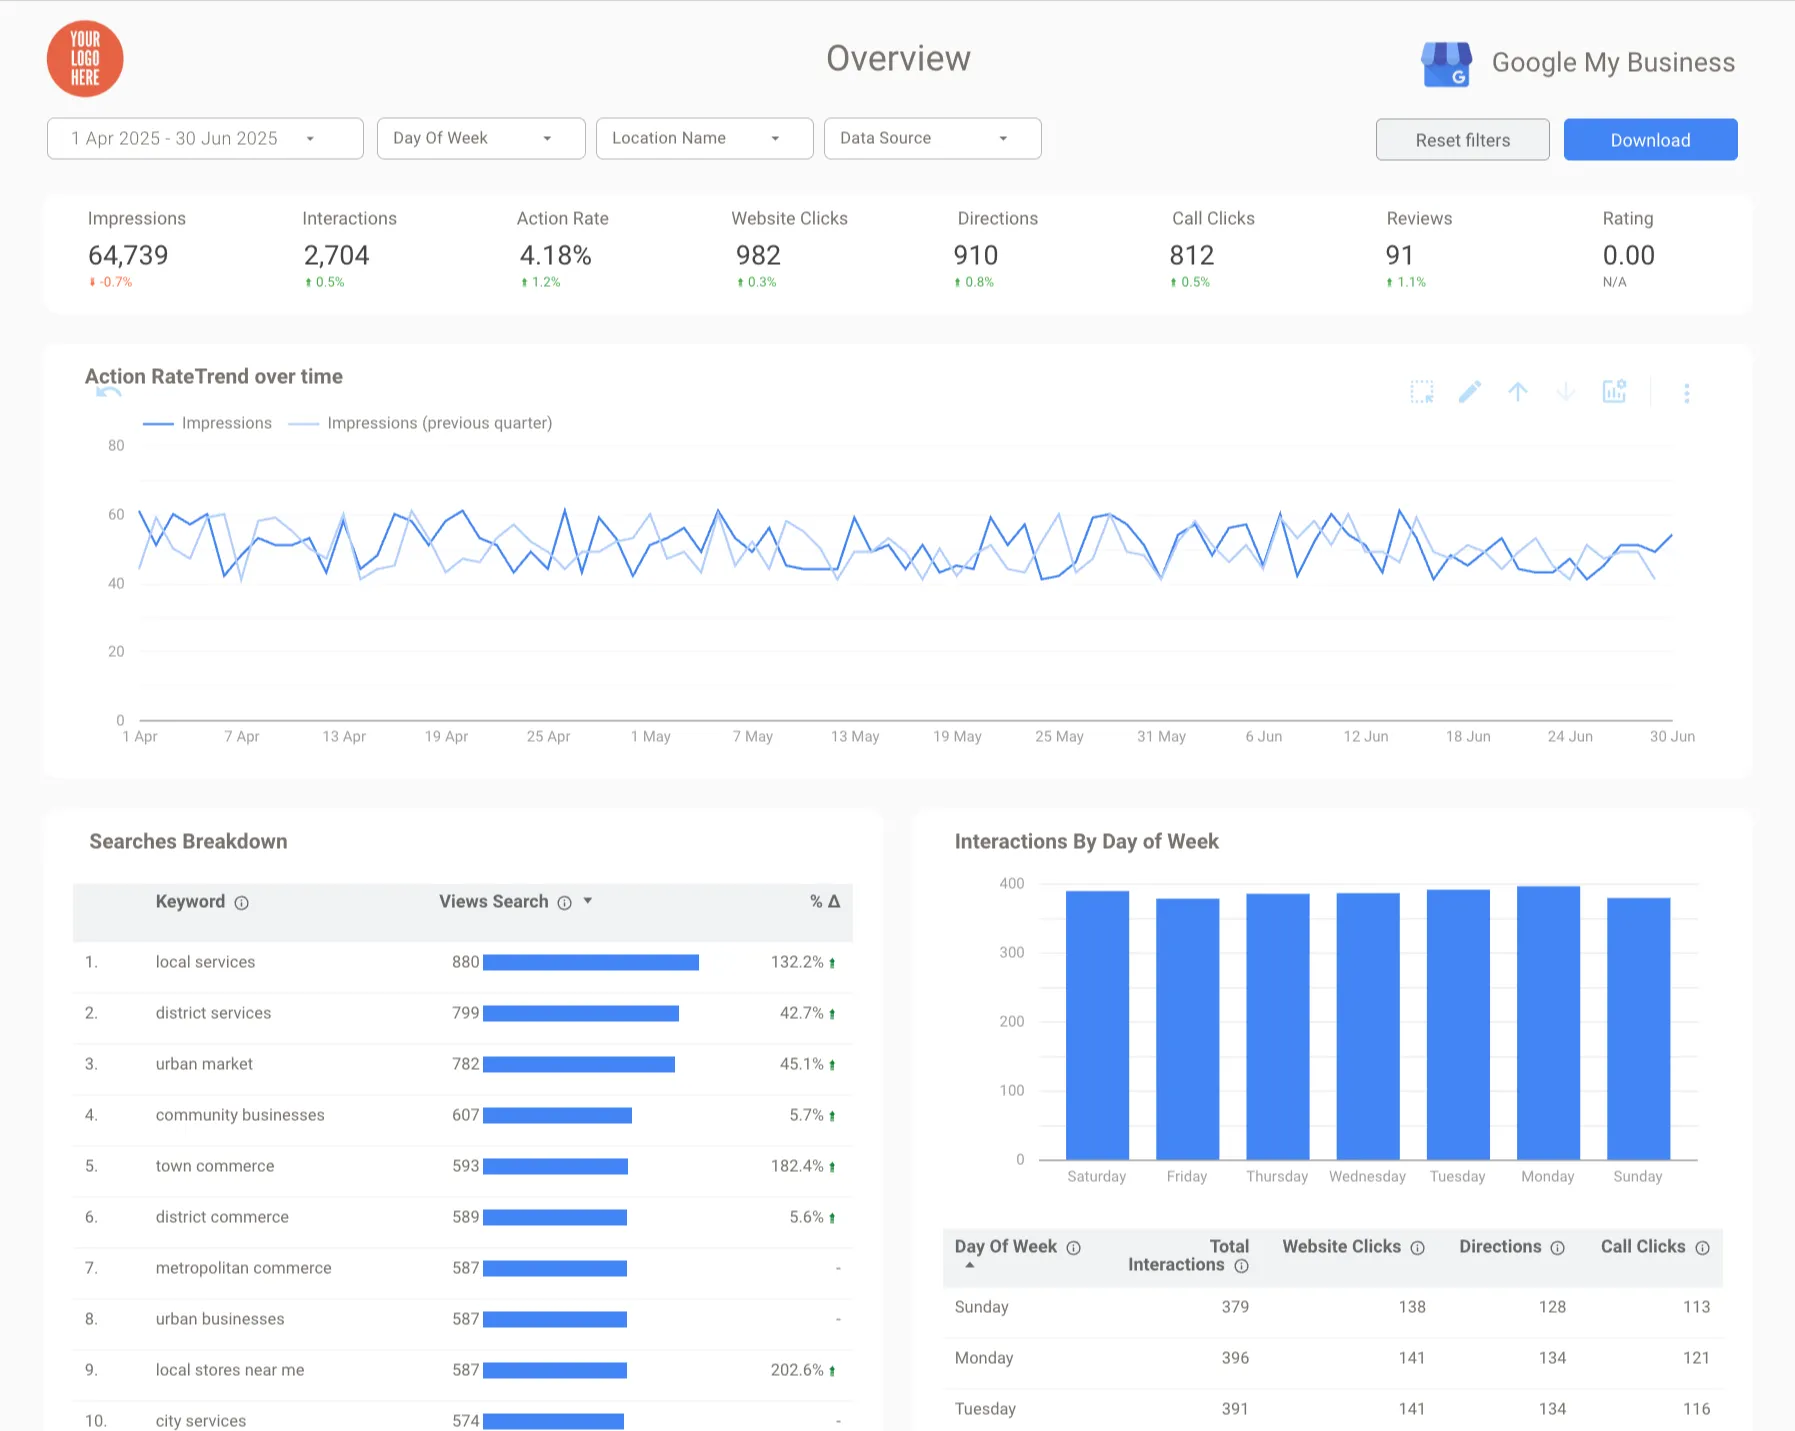
Monitor impressions, interactions, website clicks, directions, and call clicks at a glance. Includes action rate, reviews, and performance comparison vs prior periods.
📍 Location-Level Analysis
Track GMB performance by location. See total interactions and engagement types per outlet and identify which branches drive local discovery and conversions.
📅 Day-of-Week Insights
Understand customer behavior by weekday. Analyze peak performance days for calls, direction requests, and website visits.
📈 Action Rate Trends
Visualize daily changes in impressions and actions. Compare current vs previous periods to spot improvements or sudden drops in engagement.
🔍 Search Breakdown (Discovery Keywords)
See which search terms triggered your business listing. Identify high-intent queries and optimize your GMB profile accordingly.
Perfect For These Roles & Use Cases
🏪 Multi-Location Retailers
Compare performance across stores and optimize local listings for high-intent discovery.
🧰 Local Service Providers
Track call clicks and direction requests to understand which days and areas generate the most leads.
💼 Agencies Managing GMB for Clients
Deliver white-labeled local performance dashboards and actionable insights across locations.
📊 Franchises & Chains
Monitor location-level GMB data to ensure consistency, optimize engagement, and grow local presence.
🎯 Marketing & SEO Teams
Integrate local GMB data into your performance stack and improve local SEO strategy.
What You Get
✅ 5 Dashboard Sections
- Overview: Impressions, actions, action rate, calls, clicks, reviews
- Locations: Performance by store or business outlet
- Weekly: Day-of-week action patterns
- Trends: Daily changes in visibility and interactions
- Search Terms: Breakdown of search keywords triggering GMB listings
✅ 30+ Visualizations
- Impressions & actions over time
- Interaction heatmaps by day of week
- Performance tables by location
- Customer action type trends (clicks, calls, directions)
- Keyword-based discovery insights
✅ GMB-Specific Features
- Action rate monitoring (% of users who engage after seeing your listing)
- Customer interaction analysis by weekday and location
- Website, direction, and call breakdowns
- Exportable charts and scheduled PDF delivery
- Filters for time range, location, and action type
Frequently asked questions
You cannot find your question? Feel free to contact us
Google My Business Template – Looker Studio
Track, optimize, and grow your local presence with this all-in-one Google My Business (GMB) dashboard. Get actionable insights into how customers discover and interact with your business across search and maps—all in real-time.

350 marketers
Purchased the templates



 Trusted by 1000+ Agencies and Marketers