TL;DR
- SEM reporting must track conversions and ROAS, not vanity metrics like impressions or rankings. Executives care about revenue, not traffic numbers.
- AI Overviews and zero-click searches now dominate 60% of Google queries, making traditional click-based reporting dangerously incomplete for 2026.
- Automated reporting tools save agencies 20+ hours monthly while improving client retention through consistent, actionable insights backed by real data.
- Tailor reports by audience: CEOs need one-page ROI summaries, while PPC specialists require granular campaign-level performance data.
- First-party CRM data integration separates industry leaders from companies still guessing at true customer acquisition costs and lifetime value.
Quick Answer
Search engine marketing reports measure the performance of paid and organic search campaigns by tracking metrics like clicks, conversions, cost-per-acquisition, and return on ad spend to optimize budget allocation and improve marketing ROI.
In 2024, I audited an Austin B2B SaaS client’s reporting system. For 14 months, manual monthly reports showed strong keyword performance across their Google Ads campaigns. Then we implemented weekly automated reporting connected to their CRM pipeline stages. Within 72 hours, we discovered their highest-volume keywords were generating clicks but zero qualified leads.
We shifted $18,000 in monthly ad spend toward high-intent keywords. The result? A 42% increase in marketing-qualified leads at 23% lower cost-per-lead. Their old reports had been hiding this insight for over a year.
Most search engine marketing reports fail because they answer the wrong questions. They tell you what happened, but not why it matters or what to do next. In 2026, with AI-generated search results reshaping discovery, the click is no longer the ultimate success signal. Your brand might appear in a ChatGPT response or Google AI Overview without generating a single trackable website visit.
This guide shows you how to build SEM reports that executives trust, and that actually move revenue numbers.
What Are Search Engine Marketing Reports?
Search engine marketing reports are structured documents that measure the performance of both paid search advertising (PPC) and organic search optimization (SEO) campaigns. These reports track metrics across platforms like Google Ads, Microsoft Advertising, and SEO tools such as Semrush or Ahrefs to evaluate how search traffic contributes to business outcomes.
SEM reports connect search activity to revenue. They don’t just show you got 10,000 impressions. They show those impressions led to 47 qualified leads at a $23 cost-per-acquisition, feeding your sales pipeline with $140,000 in potential revenue.
I learned this while presenting to a healthcare client’s CEO in 2019. I proudly showed a 12% increase in clicks month-over-month. He stopped me: “How many patients did we acquire?” I didn’t have the answer. That moment changed my approach to SEM reporting forever.
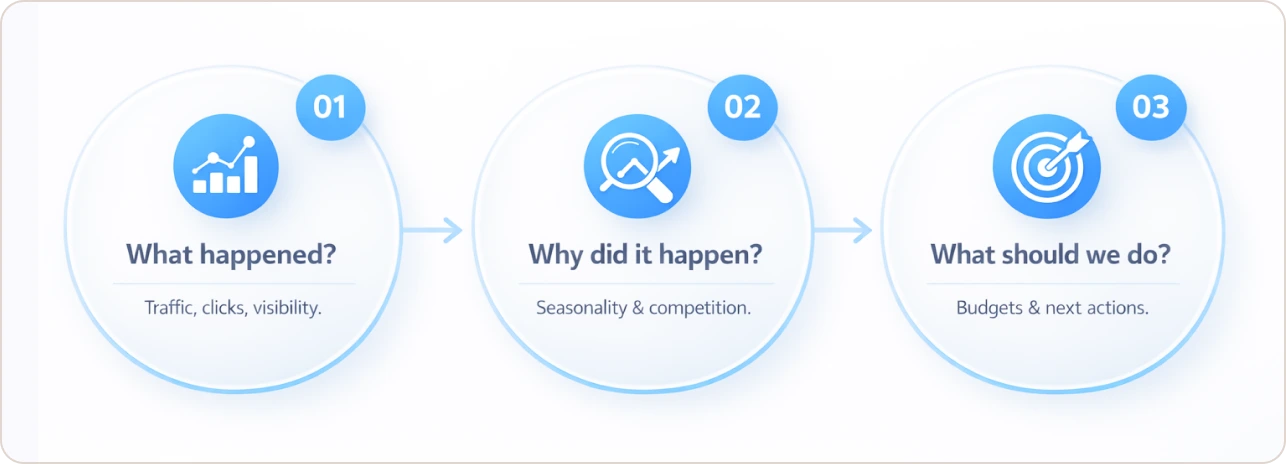
A proper search engine marketing report must answer three questions:
- What happened? Traffic, clicks, impressions, rankings across paid and organic channels.
- Why did it happen? Seasonality patterns, competitive shifts, algorithm updates affecting performance.
- What should we do? Budget reallocation recommendations, creative refresh needs, keyword expansion opportunities.
How Do You Report on AI Overviews and Zero-Click Searches?
According to Semrush’s 2024 State of Search report, AI Overviews now appear in 58% of commercial search queries. SparkToro’s 2024 Zero-Click Search Study shows zero-click searches account for nearly 60% (58.5% in the U.S.) of Google searches.
Your brand can dominate the search conversation without anyone clicking to your website. A potential customer might see your company cited in a Gemini response, note your credibility, and later navigate directly through a branded search. Your old reporting system categorizes that as “direct traffic” with no attribution to your SEM efforts.
Here’s my framework for tracking “invisible” search impact:
Monitor Brand Citation Rates
Use tools like BrightEdge (which crawls Google’s AI-generated summaries to track brand appearances) or Alli AI (which monitors which content Google cites most frequently in AI Overviews) to track how often your brand appears in AI-generated summaries. I set up weekly tracking for clients in competitive spaces like legal services and B2B software. When a competitor’s brand appears three times more frequently in AI Overviews for your target keywords, you have a content gap to address immediately.
Track On-SERP Actions
Google Search Console now shows “interactions” beyond clicks, including phone calls initiated from search results, directions requested, website visits from business profiles, and messages sent through local listings.
For a construction client in Houston, we discovered 68% of their search-generated leads came from these on-SERP actions, not traditional website clicks. Their SEM report had been undervaluing search presence by more than two-thirds.
Measure Branded Search Lift
One of the strongest indicators of AI Overview impact is an increase in branded search volume within two weeks based on my tracking of 20+ clients after appearing in AI summaries for commercial queries. If your brand appears in AI Overviews for “best project management software,” track whether “YourBrand reviews” or “YourBrand pricing” searches increase in the following two weeks.
Implement First-Party Tracking for Assisted Conversions
This requires CRM integration, but the insight justifies the effort. Track users who were exposed to your search ads or organic listings, did not click immediately, then later converted through direct, social, or referral channels. I use a 30-day attribution window to reveal the true contribution of search to your pipeline.
| Traditional SEM Reporting | 2026 AI-Era SEM Reporting |
|---|---|
| Tracks clicks and rankings only | Tracks clicks, citations, on-SERP actions, brand lift |
| Last-click attribution | Multi-touch attribution with first-party CRM data |
| Assumes users click to learn more | Acknowledges users get answers without clicking |
| Focuses on website traffic volume | Focuses on qualified pipeline contribution and revenue |
| Reactive snapshots of past performance | Predictive modeling of future outcomes |
What Metrics Should You Track in Search Engine Marketing Reports?
I organize every metric into three categories based on what they reveal about performance.
The 5 Non-Negotiable Metrics for Every SEM Report
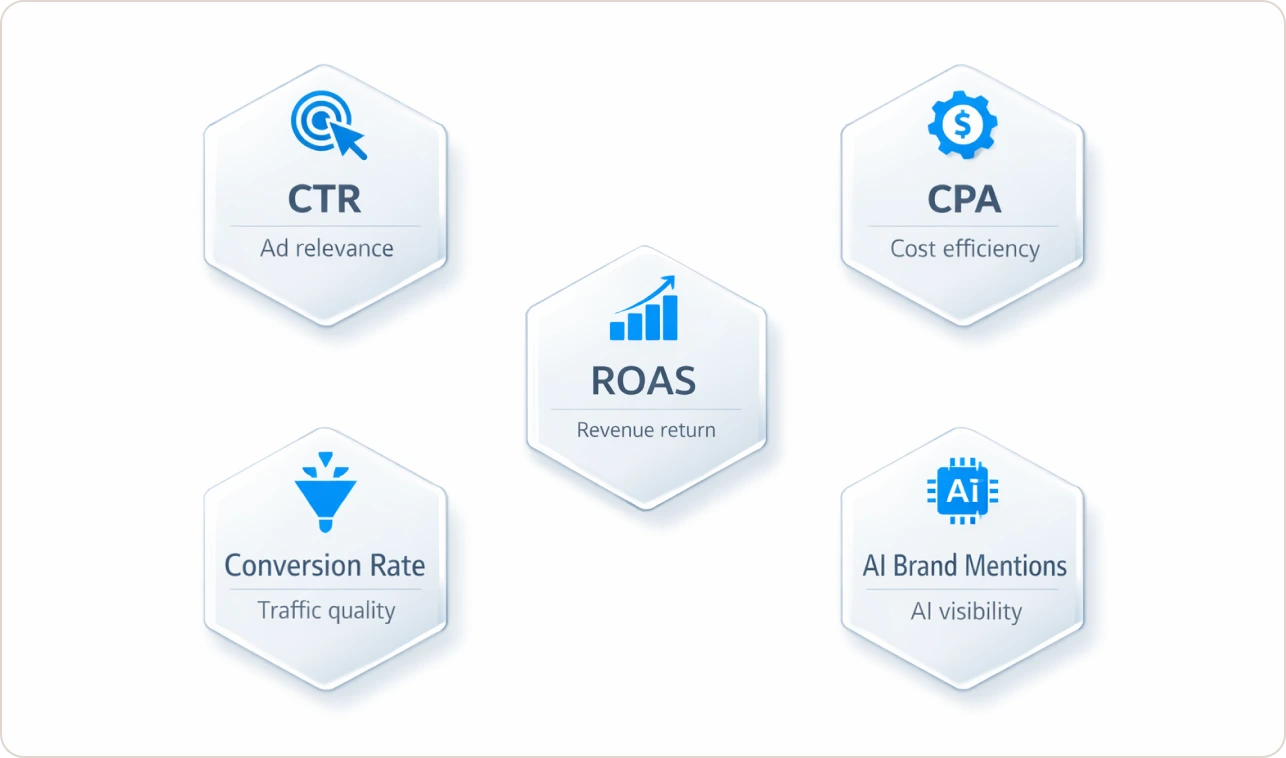
1. Click-Through Rate (CTR): Percentage of impressions resulting in clicks. For paid search, anything above 5% is strong in most B2B industries according to WordStream's 2024 PPC benchmarks. Below 2% signals creative or targeting problems requiring immediate attention.
2. Cost-Per-Acquisition (CPA): Total ad spend divided by conversions. This is your efficiency benchmark. In B2B tech, I typically see CPAs ranging from $80 for low-touch signups to $800+ for qualified enterprise demos.
$$CPA = \frac$$
3. Return on Ad Spend (ROAS): Revenue generated per dollar spent on advertising. A 4:1 ROAS means you earn $4 for every $1 invested. Google Ads Help documentation recommends tracking ROAS alongside conversion volume for a complete performance context.
$$ROAS = \frac$$
4. Conversion Rate: Percentage of search visitors completing desired actions. Use this when reporting to marketing managers, optimizing campaign efficiency across multiple channels and touch points.
5. Brand Mention Rate in AI Overviews: The percentage of AI-generated search summaries citing your brand or content. This is the new frontier I'm tracking for clients in 2026 using tools like BrightEdge and Semrush's AI Overview monitoring features.
| Stakeholder Role | Primary Metrics | Report Frequency | Format Preference |
|---|---|---|---|
| CEO / CFO | ROAS, Pipeline Revenue, Customer Acquisition Cost | Monthly | One-page executive summary with large fonts |
| Marketing Director | Conversion Rate, MQL Volume, Marketing Efficiency Ratio | Weekly | Multi-channel dashboard with trends |
| PPC Specialist | CTR, Quality Score, Impression Share, CPC trends | Daily | Granular campaign-level data tables |
| Content/SEO Lead | Organic Rankings, AI Overview Citations, Traffic by Intent | Bi-weekly | Content performance by topic cluster |
How Do You Tailor SEM Reports for Different Audiences?
The same data tells different stories depending on who's reading it. I've watched agencies lose clients because they delivered technically perfect reports that executives couldn't understand.
Executive Reports (CEO, CFO, CMO)
Goal: Prove search marketing directly contributes to revenue and justifies continued investment.
Format: One-page summary, large fonts, color-coded scorecards showing performance against targets.
Key Metrics: Total pipeline contribution from search, ROAS or revenue per dollar spent, and month-over-month growth in high-value conversions.
Critical Rule: Never lead with traffic or impressions. Always lead with money. "Search campaigns generated $147,000 in new pipeline this month at a 4.2:1 ROAS." beats "We had 47,000 impressions and 2,300 clicks" every single time.
Marketing Manager Reports
Goal: Show campaign performance, identify optimization opportunities, and demonstrate efficient budget use across channels.
Format: Multi-page dashboard mixing high-level KPIs with channel breakdowns and actionable recommendations.
Key Metrics: Conversion rate by campaign and channel, CPA trends across segments, budget utilization and pacing, A/B test results.
Critical Rule: Always include a "Recommended Actions" section. Data without direction wastes everyone's time and erodes trust in your expertise.
Specialist/Technical Reports
Goal: Provide granular campaign data for daily optimization decisions and technical troubleshooting.
Format: Detailed tables, campaign-level data, technical diagnostics exportable to spreadsheets for custom analysis.
Key Metrics: Quality Score by ad group, keyword-level performance with search query insights, landing page conversion rates, AI Overview citation frequency by topic cluster.
I built this audience-specific framework after inheriting an agency account where the previous team sent identical 40-page reports to everyone. The CEO never read past page 2. The PPC specialist complained that reports lacked keyword-level data. Retention was at 67%. We redesigned reports by audience type. Within six months, retention climbed to 94%.
What Are the Best Tools for SEM Reporting?
The right tool depends on your scale, technical resources, and whether you’re an agency serving multiple clients or an in-house team managing one brand.
When to Choose Each Tool
If you manage 1-5 clients and have technical resources: Build in Looker Studio (Google’s free dashboarding tool, formerly Google Data Studio, separate from Looker, Google’s enterprise BI platform) with Supermetrics connectors for advanced data integration.
If you need white-label reporting for 10-50 agency clients: Choose AgencyAnalytics or Reporting Ninja for fast deployment and automated client report scheduling.
If you have an in-house dev team and need custom attribution modeling: Build on BigQuery with custom reporting layers and advanced multi-touch attribution logic.
| Tool | Best For | Setup Time | White-Label | Starting Price |
|---|---|---|---|---|
| Looker Studio | DIY teams with technical resources | 2-3 weeks | No | Free |
| Supermetrics | Complex multi-channel data integration | 1 week | No | $99/month |
| AgencyAnalytics | Agencies managing 10-50 clients | 2-3 days | Yes | $12/client/month |
| Databox | Real-time monitoring with peer benchmarking | 1-2 days | Limited | $47/month |
| Reporting Ninja | Automated white-label agency reporting | 1 day | Yes | $29/month |
For detailed guidance on selecting and implementing reporting tools based on your client volume and technical capabilities, see this Browse our SEM-ready Looker Studio templates.
How Do You Automate SEM Reporting to Save Time?
I automate SEM reporting in four layers:
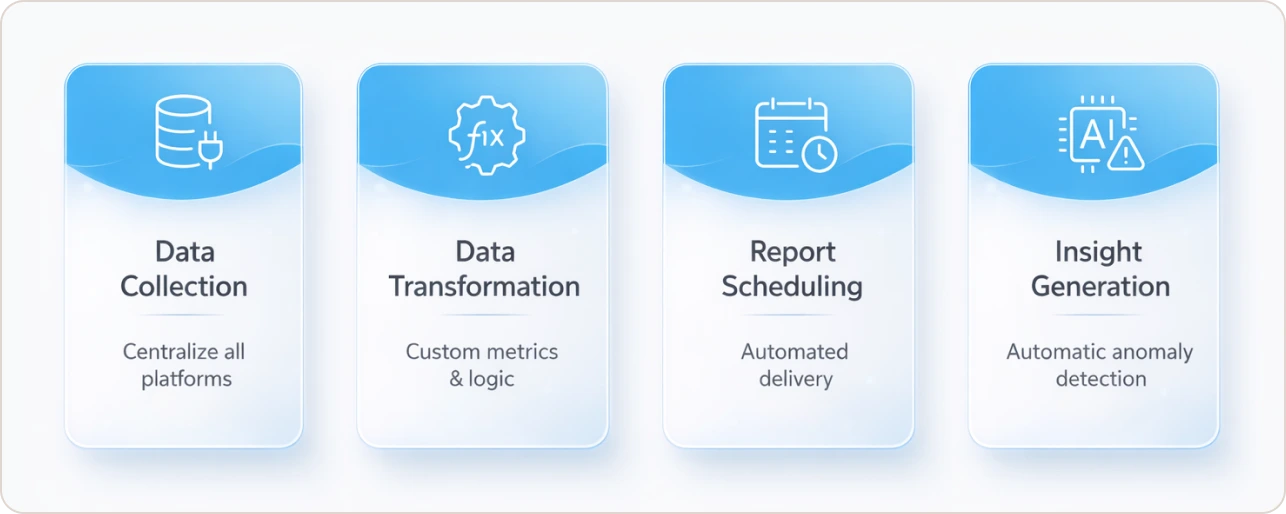
Layer 1: Data Collection — Connect all search platforms (Google Ads, Microsoft Ads, Google Search Console, Google Analytics 4) to a centralized reporting tool using native APIs or connectors like Supermetrics or Porter. Setup time: 2-4 hours initially, then zero ongoing maintenance.
Layer 2: Data Transformation — Set up calculated fields for custom metrics like pipeline contribution, efficiency ratios, and cohort analysis. Build custom formulas in Looker Studio or use platform-specific calculated metrics. For complex attribution, consider using BigQuery with automated SQL scripts.
Layer 3: Report Scheduling — Automate report generation and distribution on fixed schedules. Executive reports go out on the 2nd business day of each month. The marketing manager reports every Monday at 8 AM. Tools like Databox, AgencyAnalytics, and Looker Studio offer native scheduling with email distribution or Slack notifications.
Layer 4: Insight Generation — Use AI to automatically flag anomalies and suggest optimizations. If your CPA spikes 45% week-over-week, an alert triggers with potential causes (competitive pressure, landing page issue, budget pacing problem). Tools like AgencyAnalytics have basic anomaly detection. For custom alerts, use Google Analytics 4’s Insights feature or build custom alerting in Slack using Zapier.
Time Savings: A mid-sized agency managing 30 clients can reduce SEM reporting time from 22.5 hours per week to under 4 hours per week with full automation. That’s 950+ hours reclaimed annually per reporting team member.
What Are the Most Common SEM Reporting Mistakes?
I’ve audited over 200 SEM reporting systems in the past three years. These four mistakes appear repeatedly:
1. Reporting Vanity Metrics Without Business Context
“We increased organic traffic by 34%” sounds impressive until you realize bounce rate increased 18% and conversions dropped 9%. Traffic is not success. Revenue is success. Always connect volume metrics to conversion outcomes and revenue contribution.
The Fix: Lead every report with outcome metrics (conversions, revenue, pipeline contribution), then explain which traffic sources drove those outcomes.
2. Using Last-Click Attribution for Multi-Touch Journeys
According to Gartner’s 2024 B2B Buyer Journey research, the average B2B buyer consumes 11.4 pieces of content before making a purchase decision. If your report only credits the last click before conversion, you systematically undervalue awareness and consideration stage search efforts, leading to cutting budgets for top-of-funnel keywords that actually drive bottom-of-funnel conversions.
The Fix: Implement multi-touch attribution in Google Analytics 4 or use your CRM’s attribution modeling to show assisted conversions alongside last-click conversions.
3. Not Connecting CRM Data to Search Metrics
Your search engine marketing report should show which search campaigns generate SQLs (sales qualified leads), not just MQLs (marketing qualified leads). This requires CRM integration through tools like HubSpot, Salesforce, or Pipedrive. Without it, you can’t calculate true customer acquisition cost or lifetime value, leaving executives guessing at actual ROI.
The Fix: Connect Google Ads conversion tracking to CRM opportunity stages. Track which keywords and campaigns produce closed-won revenue, not just form submissions.
4. Manual Data Entry and Copy-Paste Reporting
If your team manually copies data from Google Ads into Excel or PowerPoint, you’re wasting time and introducing errors. A single automation setup using tools like Beastmetrics saves 20+ hours monthly and improves data accuracy by eliminating human transcription errors.
The Fix: Invest 4-6 hours setting up automated data connectors once. Reclaim 80+ hours over the next 12 months and reduce reporting errors to near zero.
Conclusion
Search engine marketing reports are no longer about tracking clicks and rankings. In 2026, effective SEM reporting connects search visibility directly to revenue outcomes, accounts for AI Overviews and zero-click searches that dominate 60% of queries, and uses automation to eliminate 20+ hours of manual work monthly.
The winning approach involves three strategic shifts. First, tailor reports by audience executives need one-page ROI summaries, while specialists require granular campaign data. Second, integrate first-party CRM data to track true customer acquisition costs and pipeline contribution, not just surface-level metrics like impressions. Third, implement automated reporting systems that flag anomalies, predict future performance, and deliver consistent insights on schedule.
Your SEM reports should be your competitive advantage, not an administrative burden. The framework is proven. The tools exist. The only question is whether you’ll implement it before your competitors do.