TL;DR:
- 58.5% of Google searches end without a click, making impression and position tracking more critical than ever
- Site Impression vs URL Impression is your first critical decision choose wrong and your reporting breaks
- Brand vs non-brand segmentation reveals whether you’re growing market share or just riding brand awareness
- The best SEO reports don’t just show what happened they tell you exactly what to do next
- Build an Opportunity Finder page that identifies high-impact, low-effort wins hiding in your data
Quick Answer
An SEO analysis report connects search visibility metrics (clicks, impressions, CTR, position) to business outcomes and identifies specific high-impact actions based on performance data over a defined period.
Most SEO reports fail because they dump charts without context.
I’ve spent six years building reporting systems for agencies and in-house teams. The reports that actually get read don’t just show metrics they answer the question every stakeholder is really asking: “What should we do differently this month?”
If you’re starting from scratch, you’ll need proper Google Analytics 4 configuration before connecting conversion data to your SEO analysis report.
Everything else (charts, trends, comparisons) only matters if it informs that decision.
Here’s the problem most teams haven’t solved yet: According to SparkToro’s 2024 study, 58.5% of Google searches end without a click. If most searches never click, why are you reporting only on clicks? That’s the visibility gap your SEO analysis report needs to close.
This guide shows you how to build a complete SEO reporting system in Looker Studio that stakeholders actually use. You’ll learn why your first data source decision (Site vs URL Impression) determines everything that follows, how to segment brand vs non-brand performance, and how to build an Opportunity Finder that turns data into prioritized actions.
What Is an SEO Analysis Report? (And What Makes One Actually Useful)
An SEO analysis report exists to answer one question: what should we do differently this month? Everything else—metrics, charts, trends—only matters if it informs that decision.
The difference between a report that gets read and one that gets ignored is simple: does it answer what changed, why it changed, and what to do next? If your report doesn’t address all three, stakeholders will stop opening it.
Here’s who you’re building for:
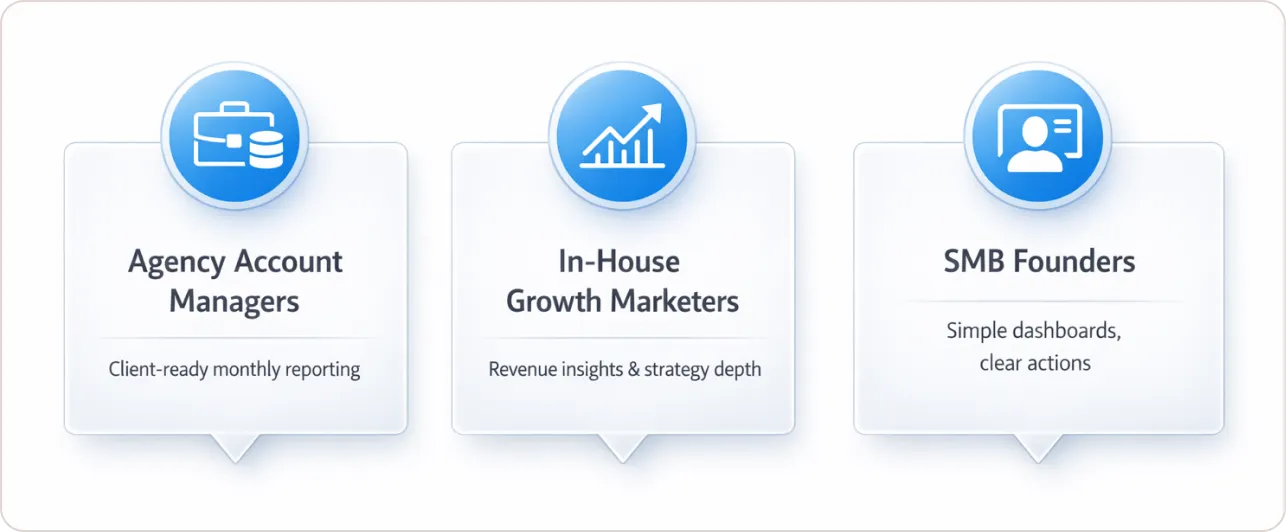
Agency account managers need repeatable, client-ready monthly reports with easy sharing, brand customization, and clear next steps in plain language that non-SEO stakeholders understand.
In-house growth marketers need executive summaries tied to revenue and conversions, plus enough depth for the team to diagnose issues and adjust strategy without a 30-minute walkthrough.
SMB founders want a template-driven path: connect data, see a dashboard, understand what changed this month, know what to do next. They don’t have time to become Looker Studio experts.
Building an effective SEO reporting strategy starts with understanding which decisions your stakeholders actually make with the data.
I once watched a CMO reject a report showing 40% organic traffic growth. Why? Because 95% of that growth came from brand queries. The report looked great but answered the wrong question. They needed to know if they were winning market share from competitors. Brand query growth just meant their other marketing was working.
That’s the difference between SEO analysis and SEO reporting. Analysis connects dots. Reporting just shows dots.
“SEO reports must bridge technical metrics and business outcomes, connecting impressions to revenue.” — Advanced Web Metrics with Google Analytics
Why Site Impression vs URL Impression Is Your Most Important Decision
Before you connect anything, you need to understand that Google Search Console offers two completely different data tables: Site Impression and URL Impression. One data source can only use one table type.
Site Impression aggregates all data at the property level for overall performance trends. URL Impression provides page-level detail for individual URLs. Choose wrong and you’ll spend hours troubleshooting why you can’t filter by URL or why your aggregation looks broken. Once the connector is set up correctly, you can put the whole report on a schedule; see our guide to automated SEO reports.
According to Google Cloud documentation, Google Search Console uses two aggregation methods, but a single data source can only use one table type. To view both in one report, create two separate data sources and add them together.
| Feature | Site Impression | URL Impression |
|---|---|---|
| Primary use case | Overall property performance, query analysis | Page-level analysis, content performance |
| Filtering by URL | No | Yes |
| Data aggregation | Property-wide | Per URL |
| Best for | Executive summaries, visibility trends | Content audits, landing page optimization |
| Common filters | Query, country, device, search type | Query, URL, country, device |
When to use Site Impression:
- Executive summary scorecards showing total clicks, impressions, and CTR
- Query performance analysis across the entire site
- Brand vs non-brand segmentation at the property level
- Device and country comparisons
When to use URL Impression:
- Identifying high-impression, low-CTR pages that need better titles
- Comparing landing page performance across your blog or product pages
- Finding pages ranking in positions 8-20 (one content update could hit page 1)
- Making content pruning decisions based on individual page metrics
I create two Search Console data sources in every report I build: one for Site Impression (executive summary and query analysis) and one for URL Impression (opportunity finder and content performance pages). This decision tree has saved me dozens of hours of troubleshooting.
What Metrics Actually Matter in an SEO Analysis Report
Every SEO analysis report needs four metric categories: visibility (are people seeing us?), engagement (are they clicking?), conversion (are they buying?), and segmentation (who are they?).
The difference between metrics and insights is context. Showing 50,000 impressions means nothing without comparison. Against last month? Last year? Forecast? Every metric needs a trend line, comparison period, or target to be useful.
| Metric Category | Primary Metrics | Data Source | Purpose |
|---|---|---|---|
| Visibility | Impressions, Average Position | Search Console (Site) | Track brand awareness and ranking trends |
| Engagement | Clicks, CTR | Search Console (Site) | Measure click-through performance |
| Content Performance | Top Pages by Clicks, Top Queries | Search Console (URL) | Identify best performers and opportunities |
| Conversions | Organic Sessions, Key Events, Revenue | GA4 | Connect search to business outcomes |
| Segmentation | Brand vs Non-brand, Device, Country | Search Console + GA4 | Understand audience behavior |
Here’s what I learned after building my 50th dashboard: don’t include metrics you can’t explain to a non-SEO stakeholder in 15 seconds. If you need three sentences to explain what “average position” means, your report is too complex.
Setting up conversion tracking in GA4 correctly is critical before building reports that connect SEO visibility to revenue outcomes.
I once built a report with 47 different metrics because I wanted to be “comprehensive.” The client looked at it once, never opened it again, and went back to asking me for “just the important stuff” in Slack. Now I start with 8-10 core metrics and add complexity only when someone asks a specific question that the current dashboard can’t answer.
How to Connect Search Console to Looker Studio (Without Breaking It Later)
Navigate to your Looker Studio homepage, click “Create” > “Data source,” search for “Search Console,” and authorize your account. Then make three decisions that determine whether your report works six months from now:
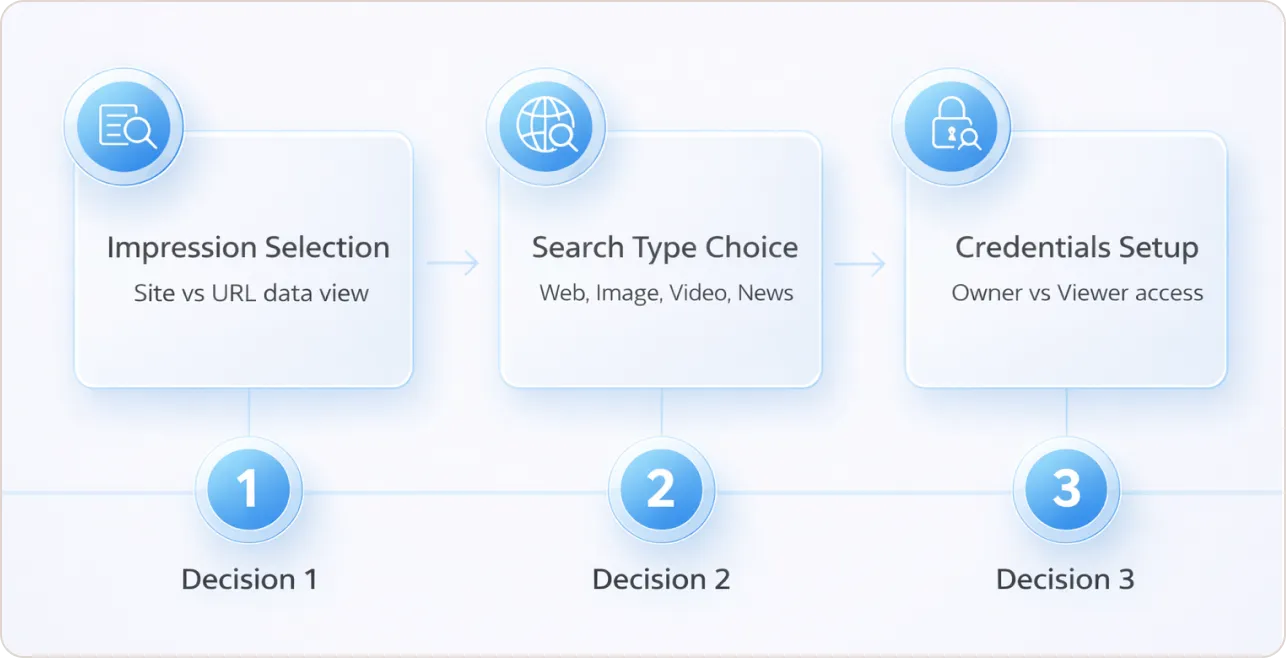
Decision 1: Site Impression or URL Impression? Choose based on the questions you need to answer. Need page-level filtering? URL Impression. Need query analysis across the whole site? Site Impression. Create both if you’re unsure.
Decision 2: Which search type? Web is standard for most reports. Only add Image, Video, News, or Discover if you actively optimize for those search types and stakeholders care about them separately.
Decision 3: Owner or Viewer credentials? This is where reports break months after launch. Owner credentials mean report viewers see data using your Search Console access. Viewer credentials mean each person needs their own access.
| Use Case | Recommended Credentials | Why |
|---|---|---|
| Agency client reporting | Owner credentials | Clients can view without needing Search Console access |
| In-house team dashboard | Viewer credentials | Each user needs their own access (better for security) |
| Executive summary | Owner credentials | Executives shouldn’t need to manage Search Console permissions |
For agency reporting, Owner credentials prevent the 2 AM “the dashboard stopped working” messages when a client’s Search Console permissions change.
Where people screw this up: They choose URL Impression thinking they can filter by query AND page in the same report. You can’t analyze both dimensions equally in URL Impression mode. If query analysis is your priority, you need Site Impression. Choose your table based on what questions you need to answer.
How to Build Brand vs Non-Brand Segmentation That Actually Reveals Growth Quality
Brand vs non-brand segmentation uses regex filters in Search Console data to separate queries containing your brand terms from queries that don’t. This segmentation reveals whether traffic growth comes from increased brand awareness or true market share expansion.
Create a calculated field in Looker Studio with this pattern:
CASE
WHEN REGEXP_MATCH(Query, ‘(?i)(yourbrand|brandvariation1|brandvariation2)’) THEN ‘Brand’
ELSE ‘Non-Brand’
END
Replace “yourbrand” with every variation people actually search: your company name, common misspellings, your product name if it’s well-known. The (?i) makes the match case-insensitive so “YourBrand” and “yourbrand” both get caught.
| Metric | Why It Matters |
|---|---|
| Brand impression share | Are you losing visibility for your own brand name to competitors or directories? |
| Non-brand impression growth | Are you reaching new audiences who don’t know you exist yet? |
| Brand vs non-brand CTR | Brand queries typically have 3-5x higher CTR—if they don’t, something’s broken |
| Non-brand conversion rate | New audiences often have different conversion behavior and longer sales cycles |
According to Search Engine Land’s Looker Studio template guide, brand vs non-brand is “one of the most important segmentations” for understanding organic growth quality.
That CMO I mentioned earlier? Once we segmented brand vs non-brand, the story changed completely. Yes, overall traffic was up 40%. But non-brand impressions were actually down 8%. The “growth” was just more people searching for their brand name after seeing billboards and podcast ads. Their SEO wasn’t getting better—their brand awareness was. Put this kind of segmentation up front in any white label SEO report you send to clients.
If your non-brand impressions are flat while brand impressions surge, you’re not growing market share. You’re benefiting from other marketing channels. That’s fine, but it’s a different story than “our SEO is crushing it.”
What Pages Your SEO Analysis Report Actually Needs
Most SEO reports show what happened. The best reports show what to do next. Here’s the page structure that does both:
| Report Page | Data Source | Primary Purpose | Key Charts |
|---|---|---|---|
| Executive Summary | Search Console (Site) + GA4 | High-level performance for executives | Scorecards, trend lines, MoM comparison |
| Visibility Analysis | Search Console (Site) | Track brand awareness and ranking trends | Impressions over time, position trends, query table |
| Content Performance | Search Console (URL) + GA4 | Identify best performers and conversion paths | Top pages by clicks, landing page conversion rates |
| Opportunity Finder | Search Console (URL) | Prioritize quick wins | High impressions + low CTR, positions 8-20 |
| Brand vs Non-Brand | Search Console (Site) | Segment growth quality | Brand/non-brand trends, CTR comparison |
| Recommendations | Manual notes | Document next steps | Text boxes with prioritized actions |
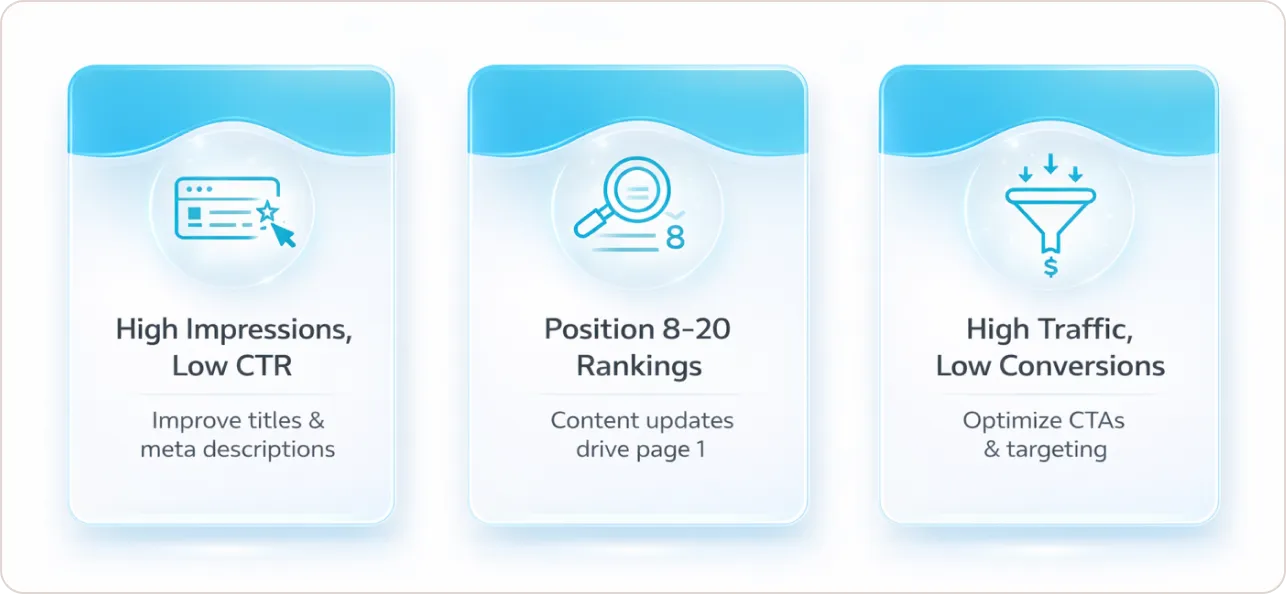
The Opportunity Finder page is what separates reports that drive action from reports that just look pretty. This page identifies specific pages with:
High impressions + low CTR means improve titles and meta descriptions. You’re showing up, people just aren’t clicking. That’s a 2-hour fix with potentially massive impact.
Average position 8-20 means one solid content update could get you to page 1. You’re close enough that incremental improvements matter.
High traffic + low conversion rate means fix your calls-to-action or re-evaluate targeting. You’re getting the traffic, just not the outcomes.
Each opportunity should include the page URL, current metrics, and the specific action to take. Not “improve content quality.” Instead: “Add FAQ section answering top 3 queries from Search Console, update publish date, add comparison table.”
This is what stakeholders pay for, not charts, but clarity on what to do next. Discover the best SEO dashboard templates
When to Blend Data (and When Not To)
Data blending in Looker Studio combines up to five data sources using join keys like page URL or date. This lets you compare search visibility (Search Console) to on-site behavior (GA4) in the same chart.
When to blend Search Console and GA4:
- Comparing search visibility (impressions, position) to on-site behavior (sessions, engagement rate)
- Connecting landing page clicks to conversion rates or revenue
- Building funnel analysis from search impression to conversion
When NOT to blend:
- Simple single-source queries where blending just adds complexity and load time
- When join keys don’t align (URL formats often differ between Search Console and GA4)
- When performance becomes noticeably slow (blending 5 sources can crawl)
According to Google Cloud documentation on blending, blends inherit credentials and freshness from underlying sources. If Search Console updates daily and GA4 updates hourly, your blend refreshes daily.
Here’s where I wasted three hours once: Google Search Console stores URLs as shown in search results (often without trailing slashes or query parameters), while GA4 landing pages include trailing slashes, UTM parameters, and sometimes fragments. Your blend will fail if these don’t match. Clean your URLs with calculated fields before blending.
For advanced reporting setups, consider custom Looker Studio dashboard development that handles complex blending and URL normalization automatically.
If you want to prioritize pages by potential impact, you can create an opportunity score using calculated fields:
CASE
WHEN Impressions > 1000 AND CTR < 0.05 AND Position < 20 THEN Impressions * (0.10 – CTR) * 100
ELSE 0
END
This scores pages by potential traffic gain if CTR improves to 10%. Pages with high impressions, low CTR, and good position get the highest scores.
Common Mistakes That Make SEO Reports Useless
The biggest mistake I see: building beautiful dashboards that answer questions no one asked.
Before creating a single chart, list the actual decisions stakeholders need to make. If a metric doesn’t inform a decision, cut it. Your report is a decision tool, not a data museum.
According to Search Engine Land’s Looker Studio reporting guidance, successful reports follow six principles:
Do:
- Show trends and comparisons (month-over-month, year-over-year, vs target)
- Connect metrics to business goals (conversions and revenue, not just traffic)
- Provide plain-English explanations for non-SEO stakeholders
- Include specific recommendations with expected impact
Don’t:
- Dump 50 metrics without narrative or context
- Use technical jargon without definitions
- Show vanity metrics that don’t connect to business outcomes
- Create static reports that require manual updates every month
I built a report once with separate pages for desktop vs mobile vs tablet performance. Know how many times anyone looked at the tablet page? Zero. Because tablet traffic was 2% of total and no one was making tablet-specific decisions. I was optimizing for completeness instead of usefulness.
Here’s my QA checklist now before sharing any SEO analysis report:
- Every metric has a comparison period or target
- At least one plain-English insight per report page (not just charts)
- Specific recommendations with page URLs and actions
- Date range control visible on first page
- Brand vs non-brand segmentation included
- Report loads in under 5 seconds
How to Share Reports Without Creating a Support Nightmare
Share Looker Studio reports using link sharing with Owner credentials for agency clients, Viewer credentials for in-house teams, or embedded via iframe on internal pages for centralized access.
| Use Case | Recommended Method | Why This Works |
|---|---|---|
| Agency client reporting | Link sharing (Owner credentials) | Clients view without needing Search Console access |
| In-house executive summary | Email scheduled reports | Recipients get PDF snapshots automatically |
| Team dashboard | Link sharing (Viewer credentials) | Each user needs Search Console access (better security) |
| Client portal | Embed via iframe | Controlled access through your own authentication system |
I embed a “How to read this dashboard” Google Doc directly in the report using Looker Studio’s external content embedding feature. This cuts support questions in half. The feature is documented in Google’s embedding guide.
The questions I used to get constantly: “What does CTR mean?” “Why did impressions go up but clicks go down?” “How do I change the date range?” Now those answers live inside the dashboard itself. People can still ask questions, but the basic ones are handled before they need to reach out.
Here’s What Separates Reports That Get Used From Reports That Get Ignored
Build two Search Console data sources (Site and URL Impression) so you can answer both “how’s our overall visibility?” and “which specific pages need work?” in the same report.
Create brand vs non-brand segmentation early. It’s the difference between vanity metrics and real growth indicators. If your non-brand impressions are flat, you’re not winning market share no matter what your total traffic shows.
Build an Opportunity Finder page that lists 5-10 concrete recommendations with page URLs, current metrics, and expected impact. This is what turns a report into a decision tool.
The reports that drive actual decisions answer three questions: What changed? Why did it change? What should we do next? If your report doesn’t address all three, you’re just making charts.
Start with 8-10 core metrics. Add complexity only when stakeholders ask specific questions your current dashboard can’t answer. The goal is clarity, not comprehensiveness.