Key Highlights:
- Build SEO reports that quantify actual revenue impact using attribution modeling and conversion value formulas
- Implement automated data pipelines that preserve Search Console history beyond Google’s 16-month limit
- Create audience-specific reporting frameworks with concrete templates for executives, clients, and internal teams
- Navigate algorithm updates and traffic drops with defensible data storytelling techniques
“Your SEO report should answer one question before any other: what should we do differently next month?”
That’s advice I got from a Fortune 500 CMO after presenting what I thought was a comprehensive SEO analytics report. She was right. My 47-slide deck had every metric imaginable but answered nothing about strategic direction.
That moment fundamentally changed how I approach seo reporting. The problem wasn’t insufficient data; it was that I’d spent 40 hours collecting numbers but zero time figuring out what decision she needed to make.
After rebuilding my approach and testing it across dozens of companies, I’ve learned that effective seo and analytics reporting isn’t about comprehensive data collection. It’s about surgical insight extraction that drives action.
Quick Answer
SEO analytics reporting transforms raw performance data into actionable business intelligence by combining Google Analytics, Search Console, and third-party tools to track rankings, traffic, and conversions, then presenting these insights through strategic narratives that connect SEO efforts directly to revenue outcomes.

The Revenue-First Reporting Framework
Here’s what separates reporting that gets ignored from reporting that secures budget increases: the ability to draw a direct line from SEO actions to revenue outcomes. According to BrightEdge research, organic search drives 53% of all website traffic. Yet most SEO reports still focus on rankings and sessions rather than actual business impact.
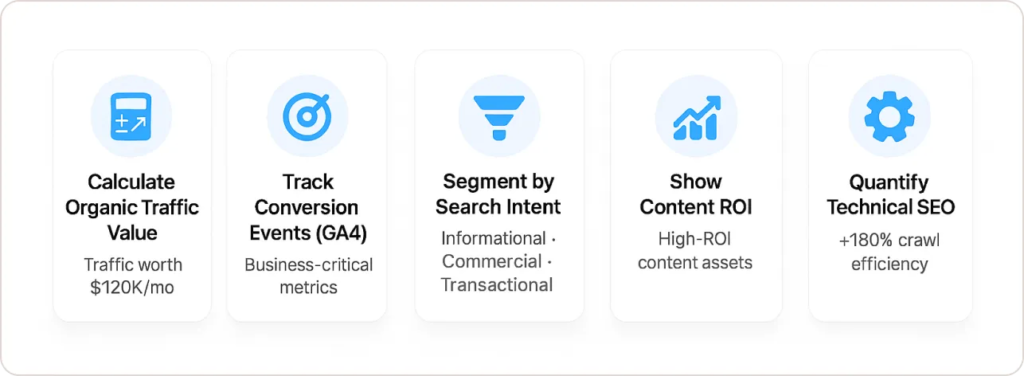
Calculate Your Organic Traffic Value Using Actual Numbers
Stop reporting raw session counts. Start every report by establishing your organic traffic’s monetary value. Here’s the exact formula I use:
Monthly Organic Value = (Organic Sessions × Conversion Rate × Average Order Value) + (Lead Gen Conversions × Lead Value × Close Rate)
For example: (10,000 sessions × 2.5% conversion × $150 AOV) + (250 leads × $4,200 value × 15% close) = $37,500 + $157,500 = $195,000 monthly organic value.
Now, when traffic drops 10%, you’re not reporting “lost 1,000 sessions.” You’re reporting “lost approximately $19,500 in monthly pipeline value, here’s our recovery plan.”
Research from Google’s Core Web Vitals study shows that pages meeting performance thresholds have 24% lower abandonment rates. Using these conversion impact numbers transforms technical improvements from “nice to have” to “this will generate $46,800 additional revenue.”
Track Business-Critical Conversion Events in GA4
Most teams track pageviews and basic goals. Here’s what you actually need configured in GA4 for meaningful seo and analytics reporting:
- Engagement-qualified sessions (30+ seconds with scroll depth >50%)
- Product/service page views (not just any pageview)
- Lead qualification events (form start, form submit, qualified lead)
- Revenue events with actual transaction values
- Assisted conversions showing SEO’s role in multi-touch journeys
I set these up using GA4’s event parameters. For example, my ‘qualified_lead’ event includes parameters for traffic_source, landing_page, and estimated_value. This granularity lets me report that “organic traffic from blog content assisted $340,000 in closed deals this quarter.”
Segment Everything By Search Intent
Generic traffic reporting masks critical insights. I always segment organic performance into branded (people already know you), commercial (high purchase intent), informational (research phase), and local (if applicable).
Last month, one client’s overall organic traffic was flat. But when segmented, their branded traffic dropped 15% while commercial intent traffic grew 47%. That’s not a flat month. That’s a massive win that poor reporting would have hidden.
According to Advanced Web Ranking’s CTR study, position one gets 27.6% CTR while position ten gets 2.4%. But here’s what matters more: commercial intent keywords at position three often drive more revenue than informational keywords at position one.
Show Content ROI, Not Just Performance
Instead of listing “top performing pages by traffic,” I report content ROI:
Content ROI = (Revenue Generated – Content Investment Cost) ÷ Content Investment Cost
That $2,500 blog post that generates 500 monthly visits looks different when you calculate it drove $18,000 in conversions over six months. That’s a 720% ROI, making it your highest-performing marketing asset.
I track this in a simple spreadsheet: Content URL | Investment | Monthly Revenue | Cumulative ROI | Next Action. This single view tells you exactly which content deserves updates, which needs promotion, and which should be deprioritized.
Include Technical SEO Impact Quantified
Technical issues mean nothing to executives until you translate them:
- “47 broken links” becomes “47 broken links causing estimated 3.2% traffic loss = $6,240 monthly revenue impact”
- “Mobile page speed 4.2 seconds” becomes “Improving to 2.1 seconds would reduce abandonment by 19% = $37,000 additional monthly revenue”
Building Reports That Scale: My Step-by-Step Implementation
Step 1: Preserve Your Search Console Data Before It Disappears
Google only keeps 16 months of Search Console data. After that, it’s gone forever. Here’s my exact solution: I use Search Console API with a scheduled script that exports data monthly to Google Sheets.
Basic implementation:
- Enable Search Console API in Google Cloud Console
- Use Python script or Google Apps Script to pull data
- Schedule it to run on the 1st of each month
- Store data in BigQuery or Google Sheets with date stamps
This preserved data becomes invaluable for three-year trend lines and proving seasonal patterns.
Step 2: Build Your Single-Source Dashboard
Stop jumping between five different tools during report creation. Here’s how I consolidated everything into one dashboard using Google Looker Studio.
Critical calculated fields to create:
|
|---|
These calculations run automatically on your data, so every report update includes fresh revenue figures without manual math.
For clients who ask about our approach: I built Beast Metrics specifically because setting up these dashboards manually became a bottleneck. We’ve created pre-configured SEO reporting templates that include these calculations and data connections already mapped. It’s what I wish existed when I was setting up my twentieth Looker Studio dashboard manually.
Step 3: Create Your Three Report Versions
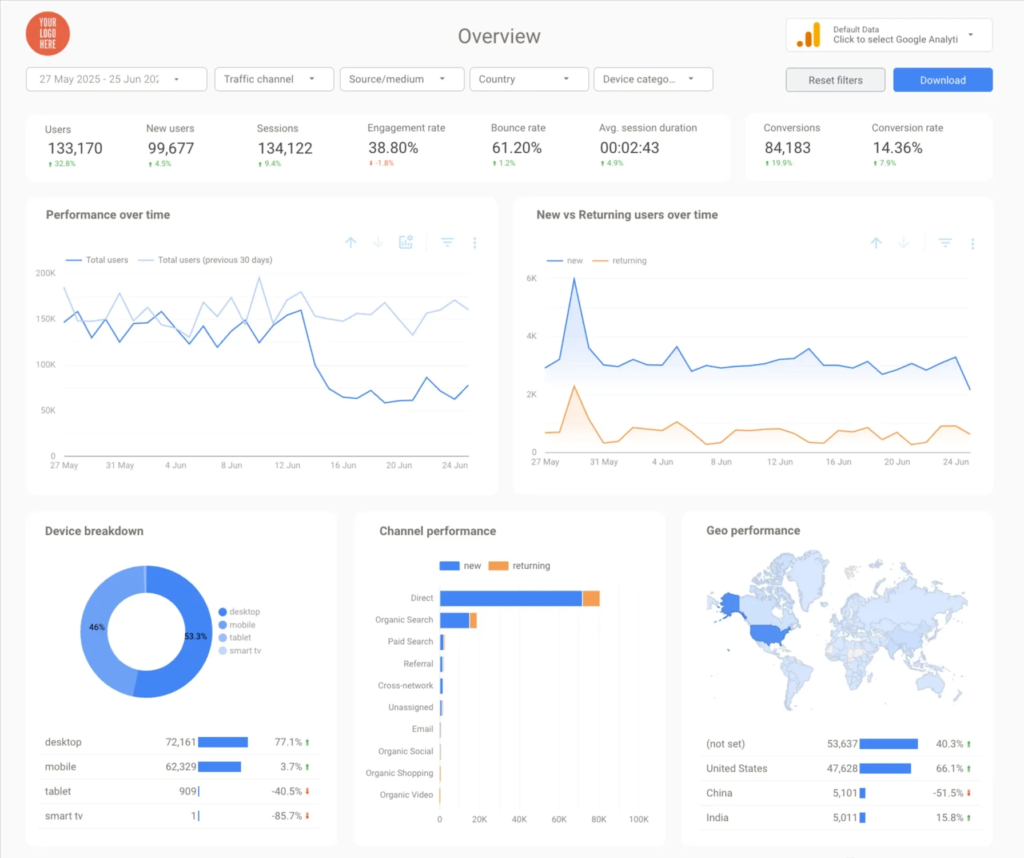
Different audiences need radically different reporting depth:
Executive Version (1 page, 5 minutes to read):
- Top-line organic revenue: current vs. target
- 3 biggest wins with dollar impact
- 2 critical issues with dollar impact
- Next month’s priorities (3 max)
Marketing Leadership Version (8-12 slides):
- Executive summary
- Traffic breakdown by intent type
- Conversion performance and funnel analysis
- Content ROI table
- Technical health with quantified impact
- Keyword opportunities ranked by potential value
- Competitive positioning
- Recommendations with effort/impact matrix
SEO Team Version (live dashboard):
- Real-time ranking tracking
- Traffic and conversion by landing page
- Technical crawl issue tracker
- Content performance table
- Backlink acquisition tracking
The Google Analytics dashboard templates approach updates automatically so team members self-serve instead of requesting custom reports.
“The most important thing in SEO reporting is showing the business impact. Data without context is just noise.” – Lily Ray, SEO Director at Amsive Digital (Source)
Advanced Attribution: Proving SEO’s Full Value
Most SEO reports drastically undervalue organic search by using last-click attribution.
Set Up Data-Driven Attribution in GA4
- Navigate to Admin > Attribution Settings
- Change from “Last Click” to “Data-Driven”
- Wait 30 days for sufficient data
- Compare organic’s attributed conversions under both models
In every implementation I’ve done, organic search’s attributed conversion value increases 30-60% under data-driven attribution because it properly credits the research and consideration phases.
Calculate Assisted Conversion Value
GA4’s exploration reports let you build custom paths showing organic assisted conversions without being the final click. I add these assisted conversions at 30% value since multiple touches contributed.
Example: Last-click reporting shows organic drove $180,000 in direct conversions. Path analysis reveals organic assisted another $340,000 in conversions. Adding 30% of assisted value: $180,000 + ($340,000 × 0.30) = $282,000 total attributed value.
That’s a 56% increase in reported value using the same data, just better attribution logic.
The Consolidation: What My Current Stack Actually Looks Like
After testing dozens of seo report tool options, here’s what I actually use daily:
Core Data Layer:
- GA4 (traffic, behavior, conversion tracking)
- Search Console (keyword performance, technical issues)
- Semrush (rank tracking, competitor intelligence, backlink monitoring)
Data Consolidation:
- Google Sheets (preserved historical data, custom calculations)
- BigQuery (for companies with lots of data, optional for most)
- Looker Studio (primary dashboard and reporting interface)
Specialized Tools:
- Screaming Frog (monthly technical audits, not for ongoing reporting)
- Excel/Google Sheets (content ROI tracking, custom calculations)
According to Moz’s State of SEO report, 76% of SEO professionals use at least three different tools. The challenge isn’t tool selection. It’s tool integration.
The workflow: Search Console API exports to Sheets, Semrush API exports to BigQuery, everything feeds into Looker Studio, dashboards update automatically. I spend zero time on data collection, 100% on interpretation and recommendations.
For teams struggling with integration complexity, explore marketing analytics dashboards that handle technical connections, though you can build this yourself with patience and API documentation.
Reporting When Things Go Wrong: The Algorithm Update Survival Guide
Frame It Immediately With External Context
Never lead with “our traffic dropped 23%.” Lead with “Google’s March core update impacted rankings across the industry. Our sites experienced a 23% traffic decrease, performing better than the industry median of 31% based on SEMrush sensor data.”
External framing demonstrates you understand broader trends, not just your isolated metrics.
Separate Controllable vs. Uncontrollable Factors
Create a two-column breakdown:
- Algorithm-driven changes (rankings drops on pages that didn’t change)
- Opportunity-driven changes (rankings drops on pages we should have updated months ago)
This honest assessment builds credibility. I take responsibility for controllable factors while providing context for uncontrollable ones.
Show Your Recovery Plan With Timeline
Generic promises don’t work. Specific actions with timeframes do:
“Recovery strategy over 8 weeks:
- Weeks 1-2: Content refresh of top 15 revenue-generating pages showing ranking drops (identified as: [specific URLs])
- Weeks 3-4: Technical optimization of Core Web Vitals on mobile
- Weeks 5-6: Backlink outreach campaign for 25 target pages
- Weeks 7-8: Performance analysis and strategy adjustment
- Expected traffic recovery: 60-70% within 90 days based on previous update recovery patterns”
This level of specificity demonstrates control and expertise during uncertainty.
Common Reporting Failures I See Repeatedly
Celebrating Vanity Wins
Early in my career, I excitedly reported “10,000 monthly organic sessions” without mentioning that 9,200 came from branded searches. My CEO correctly asked, “So we’re paying you to show up when people already want us?”
Now I always separate branded vs. non-branded traffic and celebrate growth in non-branded commercial intent traffic above all else.
Ignoring Conversion Rate Changes
Traffic increases don’t matter if conversion rates tank. I always report these together: “Organic traffic increased 24%, but conversion rates dropped from 3.2% to 2.1%, resulting in flat conversion volume. Investigation reveals new traffic comes from lower-intent informational queries.”
Data Without Recommendations
Every metric deserves an implication and recommendation. “Bounce rate increased from 45% to 68% on mobile” should immediately be followed by “Recommendation: implement lazy loading for images. Expected impact: reduce mobile bounce to 52%, preserving approximately $18,000 monthly revenue.”
Your Actual Next Steps (Be Specific This Time)
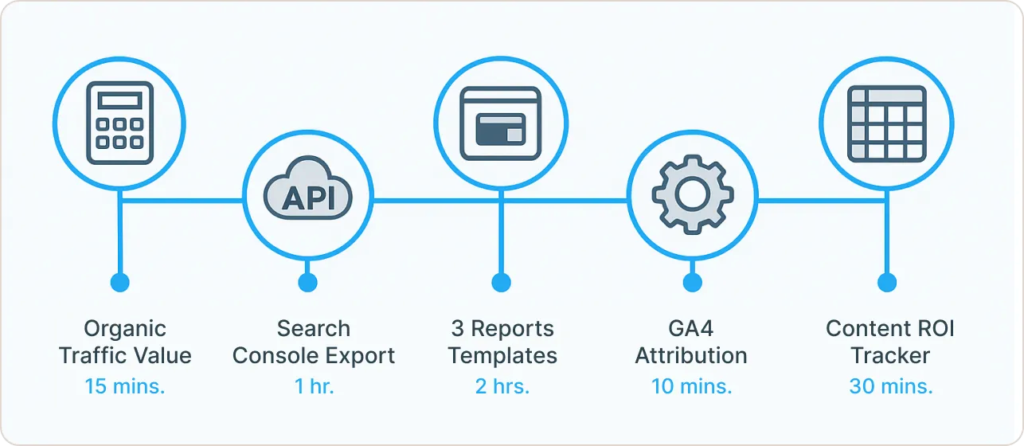
Here’s what to do in the next 48 hours:
- Calculate your current organic traffic value using the formula above (15 minutes)
- Set up Search Console API data export to preserve your history (1 hour following guides at search.google.com/search-console/about)
- Create your three report templates (2 hours: one executive summary slide, one marketing deck outline, one dashboard wireframe)
- Configure data-driven attribution in GA4 (10 minutes in Admin settings)
- Build your content ROI tracker (30 minutes in Google Sheets)
Don’t try to implement everything simultaneously. Nail the revenue calculation first. It changes every conversation about SEO’s value and makes everything else easier to justify.
The difference between reports that get ignored and reports that drive strategy isn’t complexity. It’s clarity about what decisions your data should inform.