TL;DR
- GA4 connects natively to Looker Studio in under five minutes using Google’s free GA4 connector. No paid tools needed.
- Looker Studio lets you combine GA4 with Google Ads, Search Console, and other sources in one dashboard. GA4 alone cannot do this.
- Marketing analysts spend an average of 12 to 18 hours per month on manual reporting. A connected Looker Studio dashboard eliminates that cycle.
- Most dashboards fail not because of the tool, but because they are built around data instead of decisions.
- This guide covers the exact setup steps, the five metrics that matter, common errors that break dashboards, and a ready-to-use ecommerce template.
Quick Answer
Looker Studio is a free Google reporting tool that connects to GA4 via a native connector. It enables custom dashboards, multi-source data blending, and scheduled reporting that GA4’s built-in interface does not support.
What Is the Difference Between GA4 and Looker Studio?
GA4 (Google Analytics 4) is Google’s analytics platform for tracking user behaviour across websites and apps. Looker Studio is a separate, free Google product built entirely for custom reporting and data visualisation. They are not the same tool and serve different purposes.
GA4 collects and stores your data. Looker Studio reads that data and lets you display it exactly how you want. Think of GA4 as your data warehouse and Looker Studio as your reporting layer sitting on top of it.
The naming confusion is common. Looker Studio was previously called Google Data Studio. When people search for “GA4 Data Studio dashboard,” they are looking for the same thing as “GA4 Looker Studio dashboard.” Both phrases point to the same workflow.
One important clarification worth stating directly: Looker (without “Studio”) is a separate enterprise business intelligence product on Google Cloud, typically used by data engineering teams. Looker Studio is the free, browser-based dashboarding tool available to anyone with a Google account. This guide covers Looker Studio only.
Why Should You Use Looker Studio for GA4 Reporting Instead of GA4 Itself?
Looker Studio solves three specific problems that GA4’s built-in interface cannot handle, and each one matters more as your reporting needs grow.
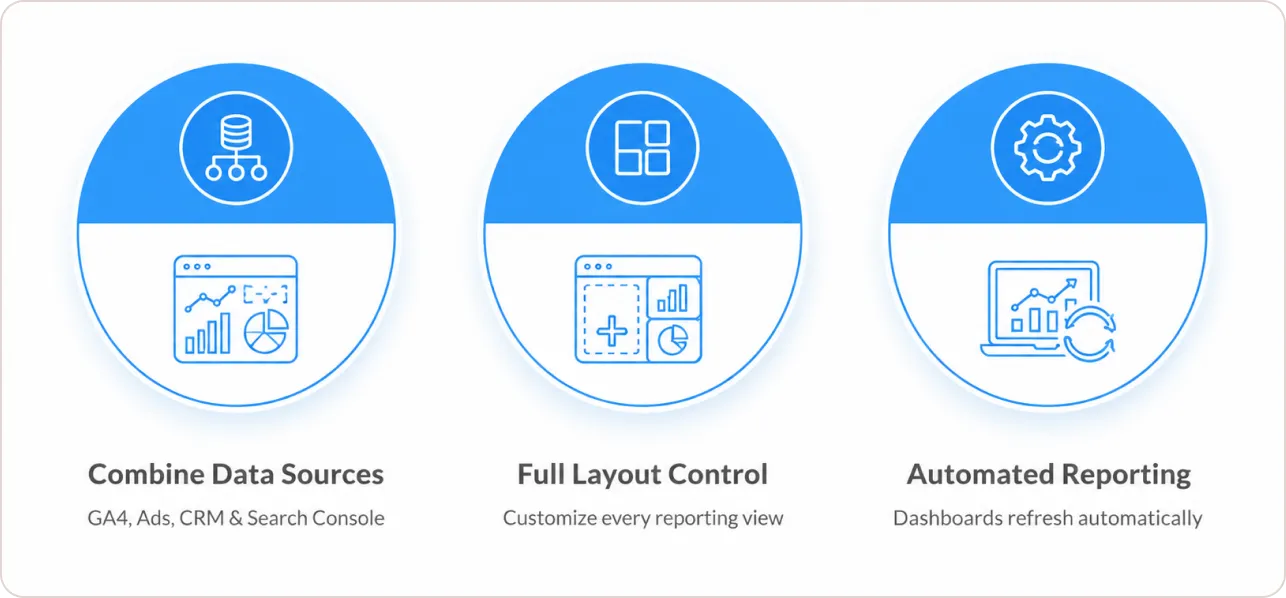
First, you can combine data sources. GA4 shows you analytics data in isolation. Looker Studio lets you pull in Google Ads spend, Search Console impressions, CRM exports, and GA4 behaviour all in one view. That cross-channel picture is where real marketing decisions get made. A session chart next to cost-per-click data tells a completely different story than either metric alone.
Second, you control the layout completely. GA4’s reports are fixed. You cannot rearrange them, remove what you do not need, or add your own calculated fields easily. Looker Studio reports are fully customisable. You choose which metrics appear, how they are visualised, and who sees what. That matters when you are presenting to a client or a leadership team that does not live inside GA4 daily.
Third, the reports update automatically. Once built, a Looker Studio GA4 dashboard refreshes on its own schedule. No exporting to spreadsheets, no rebuilding the same table every Monday morning, no copy-pasting rows into a slide deck. The stakeholder opens a link and sees the current data.
“According to DashThis, creating client reports typically takes 5–10 hours, and their AI tools can help marketers save 10+ hours per week on manual reporting.”
How Do You Connect GA4 to Looker Studio?
Connecting GA4 to Looker Studio takes under five minutes using the native Google Analytics connector. No third-party tools, no developer required.
Here is the exact process:
- Go to lookerstudio.google.com and sign in with your Google account.
- Click Create in the top left, then select Report.
- In the data connector panel, search for Google Analytics and select it.
- Click Authorise if prompted. Grant the necessary permissions to your Google account.
- Select your GA4 property from the account and property dropdowns.
- Click Add, then Add to Report to confirm the connection.
Your GA4 property is now live in Looker Studio. Every dimension and metric available in GA4, including session data, engagement metrics, key events, and user attributes, is available to use in your report.
Before you start, check one thing: the Google account you are using needs at least Read and Analyse access on the GA4 property to add it as a data source. Viewer-only access at the Looker Studio report level is not enough to create the connection. You can verify and manage property-level access inside GA4 under Admin, then Property Access Management. If you see an authorisation error or a blank data source panel, this is the first place to check.
What Should a GA4 Looker Studio Dashboard Include?
A GA4 Looker Studio dashboard should answer the questions your stakeholders ask every single week, before they ask them. If the dashboard does not map directly to a decision someone needs to make, the chart has no business being there.
Here is the five-area framework I use for most client dashboards:
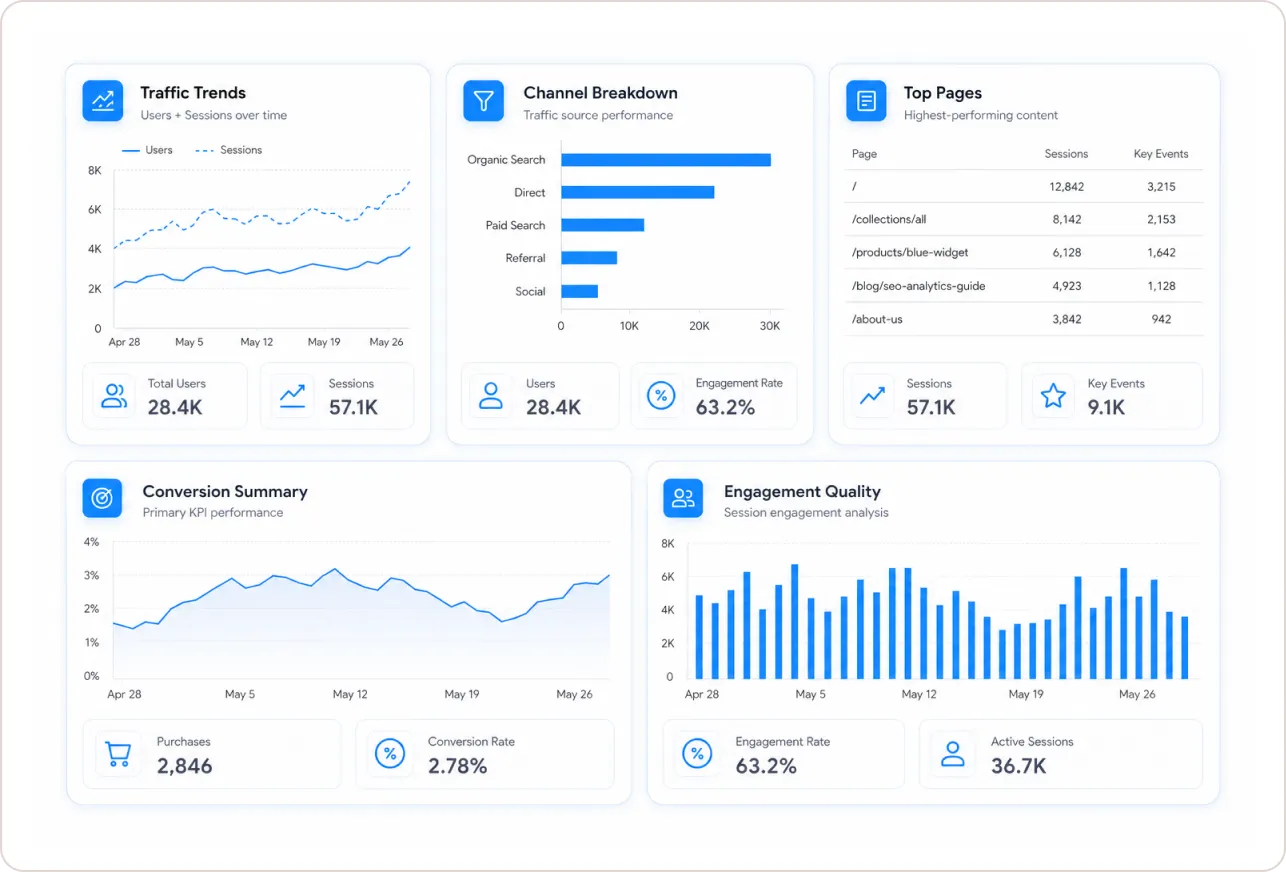
1. Traffic volume and trend. Add a date-range scorecard for Total Users and Sessions, paired with a time-series line chart covering the last 28 days. This single chart tells your stakeholders whether things are moving up or down before any meeting starts.
2. Channel breakdown. A table with Session Default Channel Grouping as the dimension and Users, Sessions, and Engagement Rate as the metrics shows where traffic is actually coming from. Use a bar chart here rather than a pie chart. Bar charts let the eye compare values accurately across categories. Pie charts are poor for this kind of data because angular differences are difficult to read precisely.
3. Top pages. A table sorted by Sessions descending with Page Title or Page Path as the dimension, alongside Engagement Rate and Key Events. This is where content teams and UX teams find their priorities. Sorted by sessions, the highest-traffic pages that have low engagement or zero conversions become immediately visible.
4. Conversion summary. A scorecard for your primary Key Event (purchase, lead form, sign-up) plus a second scorecard for the conversion rate. If conversions are the main KPI, add a channel breakdown table beneath it so the reader can immediately see which channels are delivering.
5. Engagement quality. In GA4, Engagement Rate has replaced Bounce Rate as the primary session quality metric. An engaged session means the user lasted more than 10 seconds, viewed more than one page, or triggered a conversion event. Include it as a scorecard and in your channel table. A channel driving volume with low engagement is a budget or content problem waiting to be found.
GA4 vs. Looker Studio. Which One Handles Reporting Better?
| Feature | GA4 Built-in Reports | Looker Studio with GA4 |
|---|---|---|
| Custom layouts | No | Yes |
| Multi-source data blending | No | Yes (GA4 + Ads + GSC + more) |
| Public shareable link | No | Yes |
| Scheduled email delivery | No | Yes |
| Custom calculated metrics | Limited | Yes, full formula support |
| Data retention limit | 2 months (default) or 14 months | Unlimited via BigQuery |
| Sampling on large datasets | Yes, above API threshold | Yes, inherited from GA4 API |
| Cost | Free | Free |
| Setup time | None, built in | Under 15 minutes |
| White-label and client branding | No | Yes |
GA4 native reports have one edge: immediate access with no setup. For any recurring report, any shared dashboard, or any cross-channel analysis, Looker Studio wins on every dimension. The data retention row matters most for ecommerce and long-term trend analysis. GA4 defaults to two months of event-level data retention. Looker Studio connected via BigQuery removes that limit entirely.
How Do You Add Scorecards, Charts, and Controls in Looker Studio?
Scorecards, tables, and controls are the three components that make up the core of any GA4 Looker Studio report. Here is how to add each one correctly.
Adding a scorecard. Click Insert in the top menu, then select Scorecard. Draw the box on your canvas, then set your metric in the Chart panel on the right (for example, Total Users). Add a comparison period to show week-over-week or month-over-month change automatically. Duplicate the scorecard using Ctrl+D or Cmd+D and change the metric on each copy. Building a row of five KPI scorecards this way takes about two minutes.
Adding a table. Click Insert, then Table. Set your dimension to Session Default Channel Grouping. Add Sessions, Engaged Sessions, and Key Events as your metrics. Sort by Sessions descending. Enable pagination if you have more than 10 rows. This table alone answers the most common question any stakeholder will ask.
Adding a date range control. This step is skipped in most tutorials, and it should not be. Click Insert, then Date Range Control. Place it in the top right corner of your canvas. This gives every person who views the dashboard the ability to change the reporting window without editing the report itself. Without this, every viewer is locked into whatever default date you set at build time. Add it to every dashboard you build, without exception.
Adding a filter control. Click Insert, then Drop-Down List. Set the control field to something like Device Category or Country. This turns a static report into an interactive one. A stakeholder can filter the entire dashboard to mobile traffic in one click.
How Can You Speed Up GA4 Dashboard Setup With Templates?
Starting from a pre-built GA4 Looker Studio template is significantly faster than building from a blank canvas, and it produces better results because the layout decisions have already been made and tested.
Google maintains a free template gallery at lookerstudio.google.com. To access it, click Template Gallery from the home screen and filter by Google Analytics. Select a template, click Use Template, and connect your own GA4 data source when prompted. The entire process takes under three minutes.
The right way to use a template is to start with it, delete what does not apply to your situation, and replace metrics that do not match your goals. Do not try to build everything from scratch first and then switch to a template later. That approach costs time without adding quality.
For ecommerce specifically, a template built around GA4 ecommerce events, including purchase tracking, revenue by channel, product performance, and checkout drop-off, eliminates weeks of configuration work. The metrics, dimensions, and layout decisions are already resolved.
Use the GA4 Looker Studio Ecommerce Template to get a fully structured ecommerce dashboard connected to your GA4 property in under 15 minutes.
The template includes:
- Revenue and transaction scorecards with period-over-period comparison
- Channel performance table with ROAS-ready layout
- Top products table by revenue and quantity
- Engagement quality by landing page
- Date range and channel filter controls are pre-built
Start with the template, connect your property, and the data populates automatically.
What Are the GA4 API Quota Limits in Looker Studio?
GA4 data in Looker Studio is pulled through the Google Analytics Data API. That API has quota limits per property per day, and hitting them causes “No data” errors or incomplete charts in your dashboard.
According to Google’s official Looker Studio (formerly Data Studio) documentation, reports that connect to Google Analytics 4 data are subject to Google Analytics Data API (GA4) quotas, which apply per property. When a shared report is viewed by many people and refreshed frequently, those quotas can be exhausted before the day ends.
The fix is straightforward: enable data freshness caching. In your report, go to Resource, then Manage Added Data Sources. Click Edit on your GA4 source and set Data Freshness to 4 or 12 hours. This caches the API response and serves it to all viewers without re-querying GA4 each time. For most shared dashboards, 12-hour caching is the right setting.
A second common issue is the (Other) row appearing in dimension tables. This happens when GA4 applies API-level sampling to large datasets over long date ranges. The most practical fix is to shorten your default date range. For properties with very high traffic volumes where unsampled data is required, routing GA4 event data through BigQuery before connecting to Looker Studio eliminates the sampling problem.
Is There a Way to Automate GA4 Reports in Looker Studio?
Yes, and most users who build dashboards manually every week do not know these two features exist.
Scheduled email delivery. In your Looker Studio report, click Share, then Schedule delivery. Set the frequency (daily, weekly, or monthly), add the recipient email addresses, and choose the send time. Looker Studio sends a PDF snapshot of the current dashboard automatically on that schedule. No action needed after the first setup.
Automatic data refresh. The data freshness settings described above control how often Looker Studio re-queries the GA4 API. Set to every 4 or 12 hours, the dashboard is always current without any manual refresh. The report opens with up-to-date data every time.
These two features combined mean a stakeholder receives a Monday morning email with last week’s performance, clicks through to the live dashboard for any deeper questions, and never asks you to “pull a report” again. That is the practical outcome of GA4 Looker Studio automation.
For historical data beyond GA4’s default retention, exporting raw event data to BigQuery is the next step. GA4 defaults to two months of event-level retention. Some properties are set to 14 months. BigQuery stores everything with no retention limit, and it connects directly to Looker Studio via the BigQuery connector. That setup takes more time to configure, but it gives you unsampled, unlimited historical data for trend analysis.
How to Build a GA4 Looker Studio Dashboard in Under 15 Minutes: Checklist
Use this checklist to go from a blank canvas to a shareable, functional dashboard.
- Connect your GA4 property using the native Google Analytics connector
- Add a Date Range Control to the top right of the canvas
- Add a Drop-Down Filter control for Device Category or Channel
- Add scorecards: Total Users, Sessions, Key Events, Engagement Rate
- Add a time-series line chart for Sessions over the last 28 days
- Add a Channel Grouping table with Users, Sessions, Key Events, and Engagement Rate
- Add a Top Pages table sorted by Sessions descending
- Set data freshness to 12 hours under Manage Added Data Sources
- Set share access to “Anyone with the link can view”
- Schedule a weekly email delivery to your team or client
That is a complete, functional GA4 Looker Studio dashboard. Blended data sources, calculated fields, and funnel charts are additions you layer in later. Get this version live first.
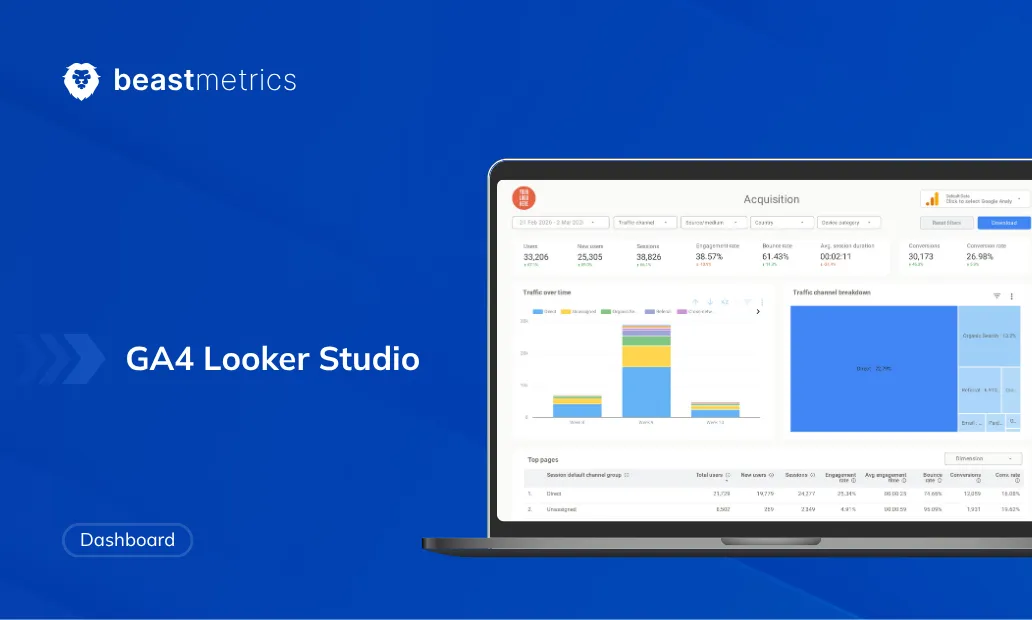
Prefer to skip the build entirely? The GA4 Looker Studio Template from BeastMetrics has every item on this checklist already configured. Connect your property and you are done.
Where Do You Go From Here?
You now have everything needed to connect GA4 to Looker Studio, build a dashboard around decisions rather than data, avoid the quota and sampling errors that break most reports, and automate delivery so the dashboard works for you after initial setup.
Three decisions will define whether this dashboard gets used or ignored six weeks from now.
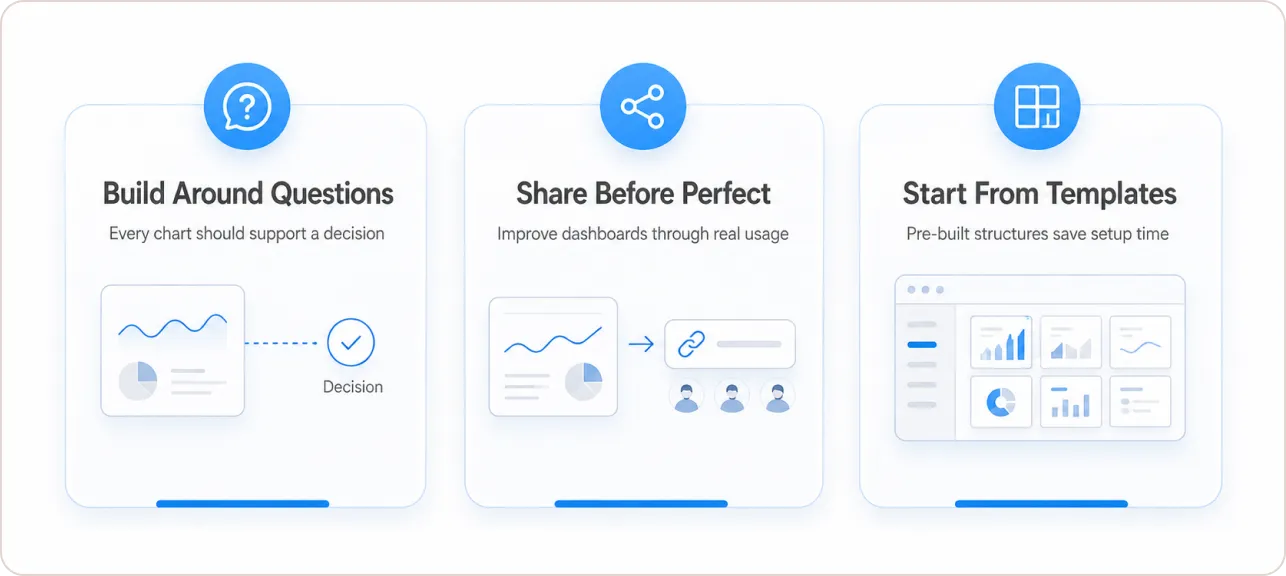
One: build around a question, not a metric. Every chart should answer something a decision-maker actually asks. If you cannot name the decision the chart supports, remove the chart.
Two: share it before it is perfect. A 70% complete dashboard that five people look at every week beats a perfect dashboard that no one opens. Get the link out early and improve it based on what people actually ask.
Three: Start from a template if you are building for ecommerce. The configuration work for purchase tracking, revenue by channel, and product performance is already done. Connecting a pre-built template takes minutes. Building the equivalent from scratch takes hours.
The GA4 Looker Studio Ecommerce Template is built specifically for GA4 ecommerce properties. Connect your data source, adjust the date range, and share the link with your team today.