Key Highlights
- Reclaim 15+ hours monthly with automated GA4 report templates
- 20-minute setup eliminates 4-6 hours of manual work per client
- Pre-built dashboards transform GA4’s complexity into clear insights
- White-label customization builds agency credibility through professional branding
- Real-time metrics update automatically without manual data extraction
The Friday Afternoon GA4 Crisis I’ll Never Forget
Still spending Friday afternoons buried in GA4 exports? With Looker Studio templates, you can automate reports in 20 minutes—and reclaim your weekends.
The client email landed at 2 PM on a Friday: “Can you send this month’s analytics report by end of day?”
I opened Google Analytics 4 and immediately felt that knot in my stomach. The interface stared back at me—unfamiliar, reorganized, nothing where it used to be. What took me 90 minutes in Universal Analytics was now consuming my entire afternoon.
I clicked through Explorations, fumbled with custom reports, and copy-pasted data into spreadsheets like I was defusing a bomb. By 4 PM, I’d barely scratched the surface.
That’s when a colleague mentioned GA4 report templates, and everything changed. Within 20 minutes, I discovered a Looker Studio GA4 report template that would’ve taken me six hours to build manually. The client received their report on time, and I never looked back.
If you’re reading this, you’ve probably experienced that same Friday panic. GA4 fundamentally transformed how Google Analytics works, and while it offers powerful capabilities, creating simple monthly reports feels like solving a Rubik’s cube blindfolded.
Why GA4 Reporting Feels Like Fighting Uphill
The Interface Problem Nobody Talks About
GA4 replaced Universal Analytics’ intuitive reports with an event-based system requiring deep understanding of parameters, dimensions, and filtering logic.
This isn’t just a visual update—it’s a complete architectural redesign that expects you to think like a data analyst.
The built-in reports offer limited customization. Want to create comprehensive Google Analytics reports for clients? You’re either learning GA4’s Exploration tools (steep learning curve) or manually exporting data to external platforms.
Neither saves time when managing multiple accounts.
Research shows that 40% of marketers cite reporting and analytics as their most time-consuming task. With GA4’s complexity, that percentage likely climbs higher.
What Clients Actually Expect From You
Here’s the uncomfortable truth: clients don’t want data dumps. They need:
- Visual clarity showing how their marketing performs at a glance
- Month-over-month comparisons demonstrating tangible progress
- Plain language insights without technical jargon
- Professional presentation reflecting your expertise
GA4’s interface wasn’t designed for client reporting—it’s built for analysts who understand event architecture.
Your clients expect analytics report templates that communicate value instantly, not raw data requiring a decoder ring.
The GA4 Reality Check
GA4 prioritizes flexibility over simplicity. Creating professional client reports requires exporting to visualization platforms like Looker Studio, where GA4 report templates transform complex metrics into clear insights within minutes instead of hours.
See Professional GA4 Template Examples →
What GA4 Report Templates Actually Solve
The Plug-and-Play Solution
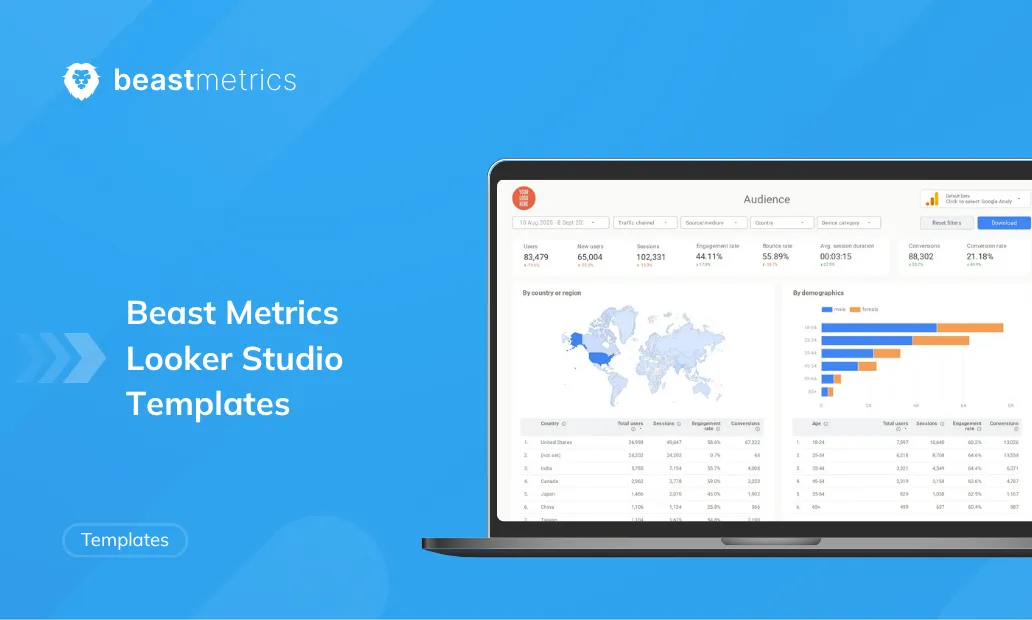
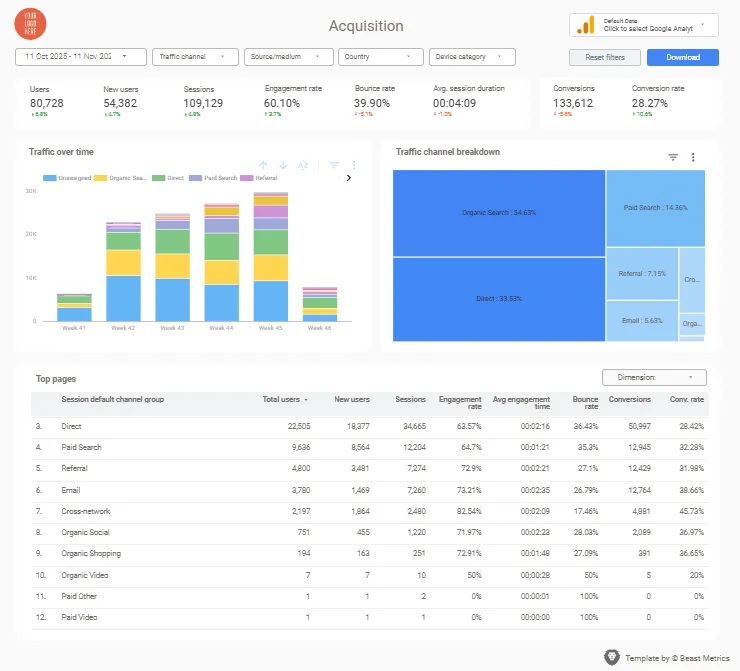
GA4 report templates are pre-configured Looker Studio dashboards that automatically connect to your Google Analytics 4 property, extract essential metrics in real-time, and present them in professional visualizations your clients immediately understand.
No technical knowledge required.
Think of them as reporting infrastructure. You connect your data source once, and the analytics report template handles everything—calculating engagement rates, visualizing traffic breakdowns, tracking conversions.
Each time someone opens the dashboard, they see current performance without manual exports or spreadsheet formulas.
These Looker Studio GA4 report templates differ fundamentally from native GA4 reports. While GA4’s built-in interface requires technical expertise, report templates for Google Analytics provide ready-made frameworks that anyone can deploy and customize within minutes.
The Time Economics That Changed My Business
Let me break down the real cost of manual reporting versus using GA4 report templates:
Manual GA4 Reporting (Per Client Monthly):
- Navigating GA4’s interface and exporting data: 75 minutes
- Building charts and formatting spreadsheets: 90 minutes
- Writing insights and preparing presentations: 60 minutes
- Total: 4-6 hours per client
Template-Based Reporting:
- Initial setup with GA4 report templates: 20 minutes (one-time)
- Monthly review and insight generation: 15 minutes
- Ongoing time: 15 minutes monthly
Managing 10 clients? You’ve just reclaimed 40+ hours monthly using report templates for Google Analytics.
That’s not just efficiency—it’s business transformation. Those hours become strategic consulting, client acquisition, or actual life outside work.
According to McKinsey research on marketing analytics, data-driven companies are 23 times more likely to acquire customers.
The opportunity cost of manual reporting isn’t just time—it’s revenue left on the table.
Essential Metrics Every GA4 Dashboard Must Include
Traffic and Engagement Foundations
Every effective Google Analytics report template displays these core metrics prominently:
User Acquisition Data:
- Total users and new users (audience growth indicators)
- Sessions and engaged sessions (quality traffic measurement)
- Traffic source and medium breakdown (channel attribution)
- Campaign performance tracking (marketing ROI)
Engagement Indicators:
- Average engagement time per session
- Pages per session and scroll depth
- Event counts by category (downloads, video plays, form interactions)
- Engagement rate by traffic source
These metrics in your analytics report template answer your client’s fundamental question: “Are we attracting the right visitors, and are they engaging with our content?”
For businesses running Google Ads campaigns, integrating paid search performance alongside organic traffic provides a complete acquisition picture.
Conversion and Revenue Tracking That Matters
For outcome-focused businesses, your GA4 dashboards must include:
Goal Completion Metrics:
- Key events (GA4’s conversion replacement)
- Conversion rate by traffic source and campaign
- Funnel visualization showing drop-off points
- Form submissions, demo requests, or lead generation events
E-commerce Performance (when applicable):
- Total revenue and transaction volume
- Average order value and purchase frequency
- Product performance and category analysis
- Shopping behavior and checkout abandonment rates
According to HubSpot’s marketing analytics research, companies that track conversion paths and user journeys see significantly higher ROI than those focusing solely on traffic metrics.
This is why comprehensive GA4 report templates include conversion tracking as a standard feature.
If you’re managing e-commerce clients, consider pairing your GA4 insights with specialized e-commerce report templates that dive deeper into product performance and customer behavior.
User Behavior Insights for Strategy
Understanding visitor interactions requires GA4 dashboards that track:
- Top landing pages and content performance (engagement drivers)
- User journey analysis (path from awareness to conversion)
- Device and geographic segmentation (audience characteristics)
- New versus returning visitor behavior (retention metrics)
When a client sees mobile visitors convert 40% less than desktop, you’ve identified optimization opportunities—not just reported numbers.
This is where Google Analytics reports for clients become strategic assets, not just data summaries.
Types of GA4 Report Templates for Different Needs
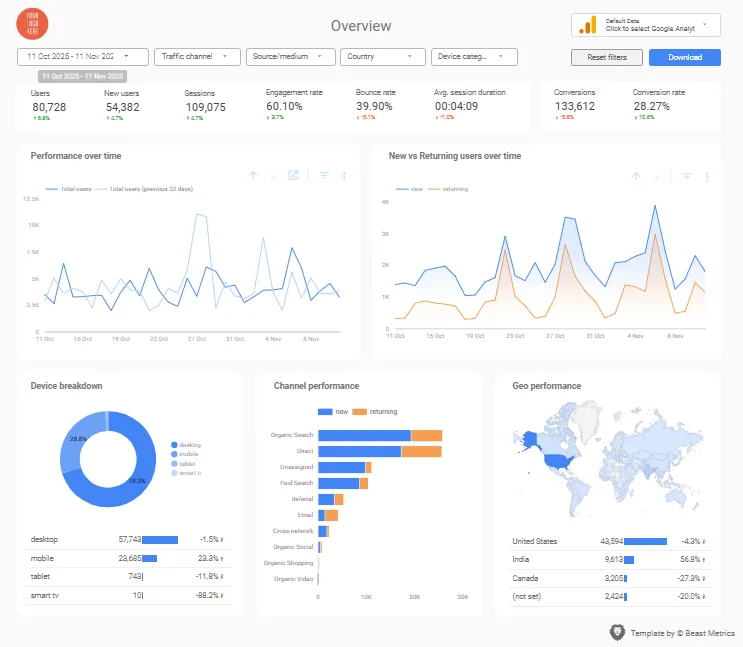
Executive Overview Dashboards
Best for: CEOs, marketing directors, busy stakeholders needing instant insights
These high-level GA4 report templates display all critical metrics on a single page with period comparisons.
They answer “How’s our website performing?” in 30 seconds.
Key components:
- Total users, sessions, revenue (if applicable)
- Top traffic sources with performance indicators
- Conversion rate trends over time
- Geographic distribution and device breakdown
Traffic Source Analysis Templates
Best for: Marketing managers optimizing channel performance
These specialized Looker Studio GA4 report templates dive deep into acquisition channels, revealing which efforts drive results.
Focus areas:
- Organic, paid, social, direct, and referral traffic comparison
- UTM parameter tracking for campaign attribution
- Landing page performance by source
- Cost-per-acquisition analysis (when connected to ad platforms)
For comprehensive organic search insights, many agencies combine GA4 traffic data with Search Console reporting to understand both rankings and user behavior.
E-commerce Performance Templates
Best for: Online retailers and product-based businesses
Revenue-focused GA4 dashboards prioritize transactional data and shopping behavior.
Essential elements:
- Product performance rankings and revenue by category
- Purchase funnel with cart abandonment visualization
- Customer lifetime value and repeat purchase rates
- Promotional campaign effectiveness tracking
Content Performance Templates
Best for: Publishers, blogs, content marketing teams
These report templates for Google Analytics emphasize page-level engagement and content effectiveness.
Tracking capabilities:
- Page views, unique visitors, engagement time by article
- Scroll depth and interaction rates
- Content category performance comparison
- Internal search behavior and popular queries
Step-by-Step: Setting Up Your First GA4 Template
Step 1: Connect GA4 to Looker Studio (5 Minutes)
Navigate to Looker Studio and create your data source for GA4 report templates:
- Click “Create” → “Data Source”
- Search “Google Analytics” in the connector gallery
- Select your GA4 property (requires Editor or Administrator access)
- Configure data freshness settings (automatic refresh recommended)
For agencies managing multiple clients, create separate data sources for each property.
Label them clearly: “Client Name – GA4 Property” prevents confusion when switching between different Google Analytics report templates.
Pro tip: If your GA4 property doesn’t appear, verify permissions in GA4’s Admin panel under “Property Access Management.”
Step 2: Deploy Your Template (3 Minutes)
Select GA4 report templates matching your reporting needs. Most businesses start with overview dashboards covering:
- Traffic sources and user acquisition
- Engagement metrics and behavior flow
- Top pages and content performance
- Conversion tracking (if events are configured)
When deploying pre-built Looker Studio GA4 report templates, the platform automatically creates a copy with all charts, tables, and filters pre-configured.
Initial data population happens within seconds, though complex queries may take a minute.
According to Google’s Looker Studio documentation, template deployment maintains all data connections while allowing complete customization.
Step 3: Customize for Client Branding (7 Minutes)
Transform your analytics report template into a white-label report reflecting your professionalism:
Visual Customization:
- Upload client logos to header areas
- Adjust color schemes matching brand guidelines
- Modify chart types (some clients prefer bar charts over line graphs)
Metric Selection:
- Remove irrelevant metrics for their business model
- Add calculated fields for custom KPIs
- Set default date ranges matching reporting period preferences
Filter Configuration:
- Enable interactive filters for device, location, or campaign segmentation
- Set up comparison date ranges for period-over-period analysis
- Create audience segments for different user types
Customizing report templates for Google Analytics ensures your clients receive branded, professional reports that reinforce your agency’s value proposition.
Step 4: Automate and Share (5 Minutes)
Configure delivery and access settings for your GA4 dashboards:
Scheduled Delivery:
- Set automated email delivery for weekly or monthly reports
- Choose PDF format for executive summaries
- Schedule delivery before standing client meetings
Access Management:
- Grant “Viewer” access to clients (see data without editing)
- Share edit access with team members needing customization
- Enable embedding for clients wanting dashboards on internal portals
Mobile Optimization:
- Preview reports on mobile devices ensuring readability
- Simplify complex tables that don’t render well on smaller screens
- Consider mobile-specific templates with larger visualizations
Customization Best Practices That Elevate Reports
Industry-Specific Metric Prioritization
E-commerce clients need transaction revenue prominently displayed in their GA4 report templates.
Lead generation businesses prioritize form submissions and contact requests in their Google Analytics reports for clients.
SaaS companies focus on free trial sign-ups and feature engagement. Publishers care about page views and reading time.
Customization principle: Lead with metrics directly connecting to your client’s revenue model in your analytics report template.
Secondary metrics provide context without competing for attention.
White-Label Design Building Credibility
Professional presentation matters as much as data accuracy.
When clients receive Google Analytics reports for clients featuring your branding, consistent styling, and thoughtful layout, they perceive higher value in your services.
Design elements that matter:
- Consistent color schemes across all report pages
- Clear section headers organizing information logically
- Adequate white space preventing overwhelming data density
- Annotation callouts highlighting significant changes or insights
Custom Calculated Fields for Unique KPIs
Looker Studio GA4 report templates allow creating calculated metrics beyond standard GA4 reporting:
- Engagement Quality Score: (Engaged Sessions / Total Sessions) × 100
- Content Efficiency: Conversions per 1,000 Page Views
- Traffic Value: Revenue / Total Users (e-commerce)
- Campaign ROI: (Revenue – Ad Spend) / Ad Spend (when cost data imports)
These custom metrics in your report templates for Google Analytics demonstrate analytical sophistication while providing clients with KPIs tailored to their business context.
Interactive Filtering Empowering Exploration
Build interactivity into your GA4 dashboards:
- Date range selectors for comparing any time periods
- Traffic source filters for drilling into specific channels
- Geographic filters for multi-location businesses
- Device category toggles for cross-platform performance
Interactive analytics report templates transform passive data consumption into active exploration, increasing client engagement with reports you provide.
Common GA4 Template Mistakes to Avoid
Mistake #1: Metric Overload Obscuring Insights
New users of GA4 report templates include every available metric, creating dashboards with 40+ data points competing for attention.
Clients get overwhelmed and miss important signals.
Solution: Follow the “rule of 3” for each section—highlight three primary metrics answering the section’s core question.
Everything else should be secondary or accessible through interaction in your Google Analytics report template.
Mistake #2: Not Mapping Events to Business Goals
GA4’s event-based model requires deliberate configuration.
Simply connecting GA4 report templates without proper event tracking results in empty conversion reports and missed insights.
Solution: Before deploying Looker Studio GA4 report templates, verify your GA4 property has key events configured for actions that matter (form submissions, purchases, video completions).
Reference Google’s event setup guide for proper implementation.
Mistake #3: Forgetting Comparison Date Ranges
Data without context means nothing in Google Analytics reports for clients.
Showing “1,000 users this month” tells clients far less than “1,000 users this month (up 15% from last month).”
Solution: Always enable period-over-period comparisons in your analytics report template.
Most effective approaches compare month-over-month and year-over-year simultaneously, accounting for seasonal variations.
Mistake #4: Ignoring Mobile Viewing Experience
Clients increasingly review GA4 dashboards on smartphones during commutes or between meetings.
Templates optimized only for desktop create frustration on mobile devices.
Solution: Test every Google Analytics report template on mobile browsers before sharing.
Simplify tables with many columns, increase font sizes for readability, and consider creating mobile-specific versions for executives primarily using phones.
Transform Your GA4 Reporting Today
GA4’s complexity doesn’t have to slow your reporting process.
Professional GA4 report templates eliminate the learning curve, automate data visualization, and deliver client-ready dashboards showcasing your expertise while saving 15+ hours weekly.
The marketers winning in 2025 aren’t spending afternoons wrestling with GA4’s interface—they’re using Looker Studio GA4 report templates to focus on strategy, optimization, and delivering results that matter.
The question isn’t whether to adopt report templates for Google Analytics; it’s whether you can afford not to.
These analytics report templates represent more than convenience—they’re strategic assets that transform how you deliver Google Analytics reports for clients.
When you eliminate manual reporting overhead, you create capacity for high-value consulting that clients pay premium rates for.
Whether you’re tracking Facebook ad performance, website analytics having a unified reporting system saves countless hours while improving client satisfaction.