Key Highlights
- Save 8-12 hours monthly per client with automated Google Ads report templates that update in real-time
- Maintain visual consistency while enabling full white-label customization for your agency branding
- Track essential metrics like ROAS, conversion rate, Quality Score, impression share, and cost per conversion
- Blend cross-platform data by combining Google Ads with Analytics, CRM, and other marketing channels
- Build once, deploy everywhere with multi-account management using MCC integration
- Access performance anytime, anywhere with mobile-optimized dashboards and interactive filters
Introduction
Manual Google Ads reporting steals your time, kills your weekends, and leaves clients waiting. There’s a better way—and it starts with automated templates.
It was 11 PM on a Sunday, and I was still logged into Google Ads, manually copying campaign performance numbers into a PowerPoint presentation for Monday’s client meeting. Sound familiar?
For months, this had become my dreaded monthly ritual: hours of clicking through campaign tabs, screenshotting charts with inconsistent formatting, and desperately trying to make everything look professional before the morning deadline.
Then I discovered Google Ads report templates in Looker Studio, and everything changed. What used to consume an entire evening now takes about 30 minutes for initial setup—and then updates automatically forever.
If you’re still wrestling with manual Google Ads reporting, this guide will show you exactly how to break free using professional google ads report template solutions.
What Are Google Ads Report Templates?
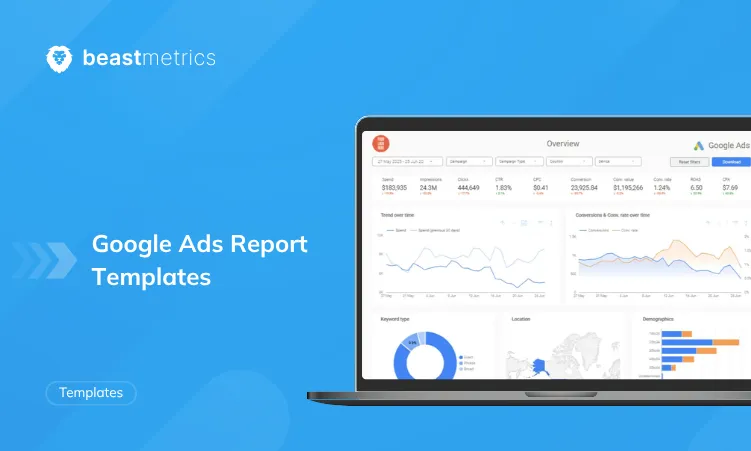
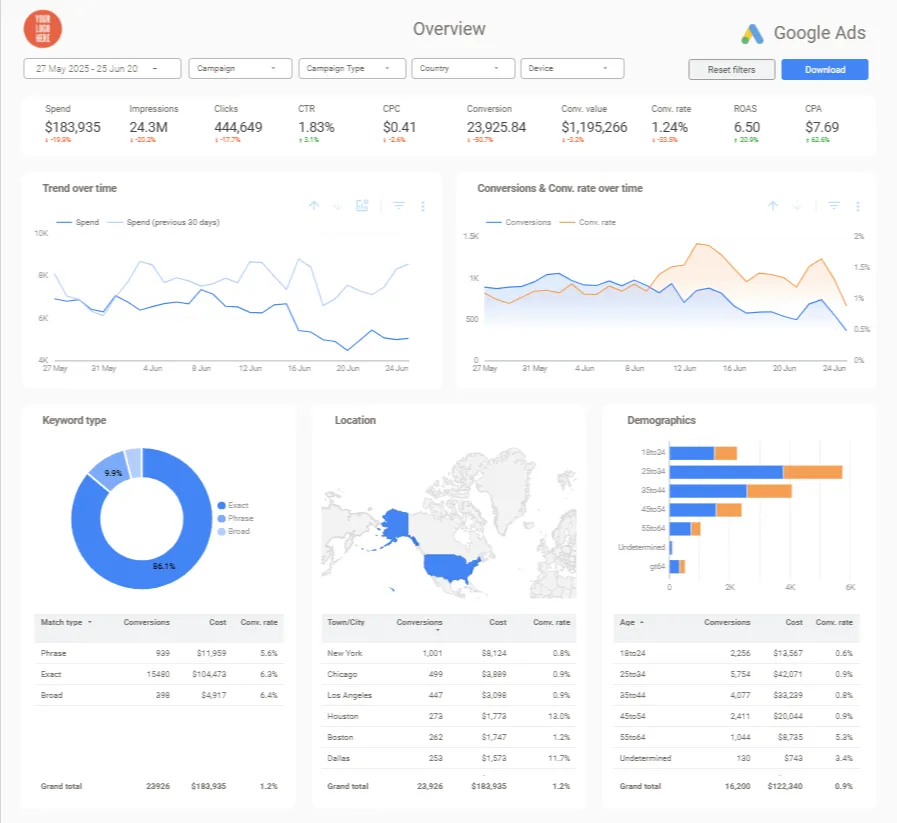
A google ads report template is a pre-built Looker Studio dashboard that automatically connects to your Google Ads account, pulls campaign data in real-time, and presents performance metrics through professional visualizations.
Unlike manual reporting where you export data and create charts yourself, a google ads reporting template refreshes automatically and maintains consistent formatting across all clients.
Think of it like the difference between building a house from scratch versus moving into a beautifully furnished home. The foundation, walls, and interior design are already complete—you just need to add your personal touches and move in your data.
Why Google Ads Templates Beat Manual Reporting
Manual google ads reports typically require 8-12 hours monthly per client when you factor in data extraction, chart creation, formatting, and quality checks.
A data visualization template approach takes about 30 minutes for initial setup, then refreshes with fresh data every time someone opens the dashboard.
According to HubSpot’s State of Marketing Report, marketers spend nearly 16 hours per week on reporting tasks—time that could be invested in strategy, optimization, and client communication instead.
Automated PPC reports eliminate this time drain while improving quality through:
- Consistency: Every report dashboard follows the same professional format, making month-over-month comparisons effortless
- Accuracy: Direct API connections eliminate transcription errors from manual data entry
- Live access: Stakeholders can check current performance anytime without waiting for scheduled reports
- Professional presentation: Pre-designed visualizations look polished and executive-ready from day one
Essential Metrics in Google Ads Report Templates
Not all metrics deserve equal space in your google ads report template.
The best Looker Studio reporting systems prioritize metrics that drive business decisions while keeping supporting data accessible for deeper analysis.
Campaign Performance Metrics That Matter
Every effective google ads reporting template should prominently display:
Return on Ad Spend (ROAS) – The ultimate profitability metric showing revenue generated per dollar spent on ads
Conversion Rate – Percentage of clicks turning into valuable actions (purchases, leads, sign-ups)
Cost Per Conversion – How much you’re paying to acquire each customer or lead
Click-Through Rate (CTR) – Indicator of ad relevance and appeal to your target audience
Cost Per Click (CPC) – What you’re paying for each visitor to your landing pages
For example, an e-commerce client might see ROAS of 4.2x in their google ads template, meaning every $1 spent generates $4.20 in revenue. But if conversion rate is dropping, that ROAS might be masking inefficient traffic that’s getting more expensive over time.
Account Health and Competitive Context
Beyond surface-level performance metrics, professional report dashboards should track optimization opportunities:
- Quality Score trends – Google’s assessment of ad relevance, landing page experience, and expected CTR
- Impression share – Percentage of possible impressions your ads are actually capturing
- Lost impression share – Opportunities missed due to budget or rank limitations
- Search term performance – Which actual queries trigger your ads and how they convert
I always add Quality Score tracking to my google ads reporting template because it’s an early warning system. When Quality Score drops, you know CPCs will rise before it shows up in cost data—giving you time to fix issues proactively.
Research from McKinsey on data-driven marketing shows that companies contextualizing metrics with competitive benchmarks make better strategic decisions.
Include these contextual metrics in your google ads template:
- Auction insights: How your impression share and average position compare to competitors
- Geographic performance breakdown: Which locations generate the best ROAS and conversion rates
- Device performance: Mobile, desktop, and tablet conversion patterns
- Hour-of-day analysis: When your audience is most likely to convert
Types of Google Ads Report Templates
Different stakeholders need different views of your google ads reports.
The best approach is using specialized data visualization templates for specific purposes rather than building one massive dashboard that overwhelms everyone.
C-level executives don’t want to see every keyword performance detail in their google ads report template. They want to know: Are we making money, and how does that compare to last month?
Executive dashboards should focus on high-level ROI and ROAS trends, budget pacing and spend efficiency, month-over-month and year-over-year comparisons, and 3-5 key metrics maximum with clear business impact.
Campaign Performance Templates
For marketing managers and PPC specialists, google ads template designs should provide detailed campaign-level analysis.
This includes campaign, ad group, and keyword performance breakdown, budget allocation across campaigns, conversion path analysis, and optimization recommendations based on performance patterns discovered through your google adwords template.
E-commerce and Multi-Account Templates
If you’re running Shopping campaigns or tracking e-commerce revenue, your google ads reports need product-level detail.
This includes Shopping campaign performance by product category, product-level ROAS and profit margins, and revenue attribution across the customer journey.
Agencies managing multiple clients need portfolio-level visibility with cross-account performance comparison using Looker Studio reporting systems, portfolio-level budget management, scalable white-label design with client branding, and MCC (My Client Center) integration for seamless data access.
Step-by-Step: Setting Up Your Google Ads Report Template
The technical setup for google ads reporting templates is simpler than most people expect.
Here’s how to go from zero to fully functional google ads looker studio templates in about 30 minutes.
Step 1: Connect Google Ads to Looker Studio
First, create the data connection between your Google Ads account and Looker Studio for your automated PPC report.
This foundational step ensures your dashboard pulls accurate, live data directly from your advertising campaigns.
Follow these steps to establish the connection:
- Open Looker Studio and click Create → Data Source
- Search for and select Google Ads from the connector list
- Authenticate with your Google account that has access to the Ads account
- Select the specific Google Ads account you want to connect
- Configure the refresh schedule (I recommend daily automatic refresh for your google ads report template)
For agency users managing multiple clients, connect your MCC account instead of individual accounts.
This allows you to create one google adwords template and easily swap which client account it displays by simply changing a filter.
Step 2: Customize Template Design for Your Brand
Once your data source is connected, customize the visual design of your google ads reporting template to match your brand.
This is where your report dashboard transforms from a generic layout into a professional, client-ready presentation that reflects your agency’s identity.
Apply these customization elements:
- Add your company logo and client branding elements to the header
- Adjust color schemes to match brand guidelines throughout the dashboard
- Select which metrics to display based on specific client goals and KPIs
- Organize layout for logical flow (I prefer overview at top, detailed breakdowns below)
White-label customization is critical for agencies using data visualization templates. Your clients should see their brand and your expertise—not a generic dashboard that looks like everyone else’s.
Step 3: Configure Filters and Date Ranges
Interactive controls make your google ads template far more useful than static PDFs.
These dynamic elements allow stakeholders to explore data on their own terms, drilling into specific campaigns, time periods, or performance segments without requesting new reports.
Essential interactive controls to include:
- Date range controls: Allow viewers to switch between different time periods
- Campaign filters: Enable drilling into specific campaign performance
- Comparison toggles: Show current period versus previous period or year-ago performance
- Device and geography filters: Let stakeholders explore performance patterns in your Looker Studio reporting system
I always set the default date range to “Last 30 days” with comparison to “Previous 30 days” enabled in my google ads reports.
This gives immediate context on whether performance is improving or declining.
Step 4: Automate Sharing and Delivery
The final step for your google ads reporting template is making sure stakeholders can access reports without manual sending.
Automation here saves you from becoming a report distribution service and ensures clients always have access to current data.
Set up these sharing and automation features:
- Share report links with view-only access for clients
- Schedule email delivery for automated distribution
- Set up mobile optimization so report dashboards work perfectly on phones and tablets
- Configure PDF export for stakeholders who prefer downloadable files
Need help with technical setup? Google’s Looker Studio documentation provides detailed guides on every feature and capability for google ads templates.
Template Customization Best Practices
Generic google ads report templates work okay, but customized data visualization templates work brilliantly.
The difference comes down to understanding what each stakeholder actually needs to see.
E-commerce clients need product-level ROAS prominently displayed in their google ads template, while lead generation businesses prioritize cost per lead and quality metrics.
Service businesses might care most about phone call conversions and form submissions in their automated PPC report.
Here’s my customization framework for google ads reports:
Interview stakeholders about which 3-5 metrics they check most frequently, place those metrics in the top overview section, organize supporting details logically below, and remove irrelevant metrics that create noise.
Professional google ads report template designs follow visual hierarchy principles with scannable layouts placing important metrics top-left where eyes naturally go first.
Use consistent formatting with same chart types for similar metrics, and strategic color coding for quick comprehension.
Research from Nielsen Norman Group on F-pattern scanning shows users scan content starting at the top left, scanning right, then moving down the left side.
Structure your Looker Studio reporting system layout to match this natural behavior.
Once comfortable with basics of google ads reporting templates, explore advanced capabilities.
Create calculated fields for custom metrics like “Profit per Click” or “Effective CPM”, blend data sources combining Google Ads with Analytics or CRM information in your report dashboard, use conditional formatting highlighting metrics that exceed targets, and add interactive drill-downs letting users explore underlying details.
Common Google Ads Template Mistakes to Avoid
I’ve built hundreds of data visualization templates, and I see the same mistakes repeatedly.
- The biggest mistake with google ads template design is displaying every available metric without prioritizing what matters.
- Focus on 5-7 key metrics in your primary google ads reporting template view, with detailed breakdowns available through filters or separate pages.
- More than 40% of report dashboard views happen on mobile devices.
- If your google ads report template requires desktop viewing to be readable, you’re creating friction for stakeholders who want to check performance on the go. Test your google adwords template on your phone before sharing.
- Automated PPC reports provide live access, but that doesn’t help if stakeholders forget to check them.
- Set up automated alerts in your google ads reporting template for budget pacing issues, conversion rate drops, ROAS falling below targets, and unexpectedly paused campaigns.
Not Aligning to Business Goals
- Always start with business goals when building google ads reports, then select metrics measuring progress toward those goals.
- A data visualization template perfect for e-commerce might be completely wrong for B2B lead generation.
Maximizing Google Ads Template Value
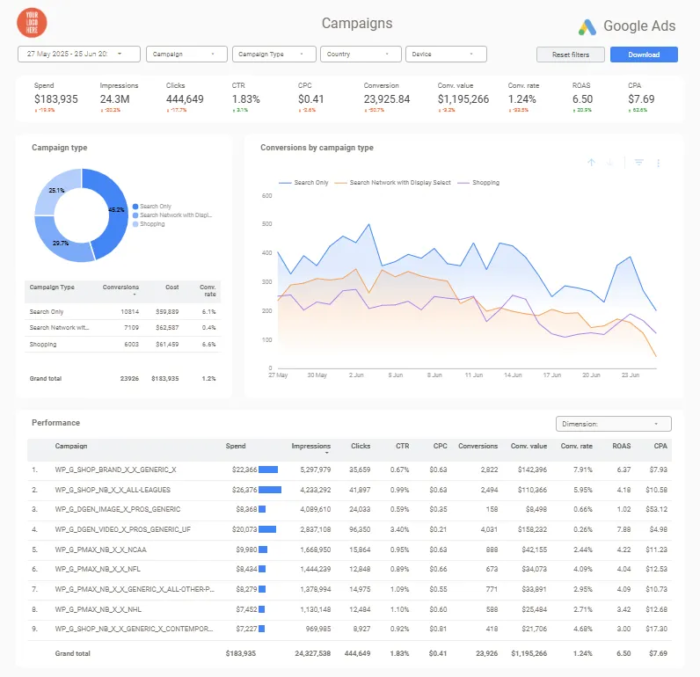
Once your google ads report template is running, advanced strategies help extract maximum value from your Looker Studio reporting system.
Always compare your google ads reporting template outputs to the Google Ads interface during the first few weeks.
Create a checklist for your report dashboard: Do total impressions match between dashboard and Google Ads UI? Are conversion counts identical in your google ads reports? Do date ranges accurately reflect the selected period?
E-commerce businesses should prioritize product-level ROAS and profit margins in their google ads report template, connecting Google Ads data with product catalog information.
B2B lead generation needs lead quality tracking beyond conversion counts in automated PPC reports, ideally connecting to CRM data showing which campaigns generate qualified leads becoming customers.
Local service businesses should emphasize geographic performance and call tracking in their google ads reporting template.
SaaS companies need funnel analysis connecting free trial sign-ups to paid conversions in their data visualization templates, tracking the full customer journey from ad click to revenue.
The most powerful google ads reports don’t stop at Google Ads alone.
Blend your google ads template with Google Analytics for full customer journey visibility, Facebook Ads for cross-platform comparison, CRM data connecting advertising spend to actual revenue in your report dashboard, and Google Search Console understanding how paid and organic search complement each other.
For agencies looking to combine their paid advertising data with organic search performance, explore our guide on SEO Search Console dashboard reporting to create unified marketing dashboards.
This holistic view in your google ads reporting template helps answer the questions stakeholders actually care about: “Which marketing channels drive profitable growth, and where should we invest more?”
Transform Your Google Ads Reporting Today
Professional google ads report template solutions eliminate the tedious manual reporting cycle that consumes hours weekly while improving quality through consistency, accuracy, and live access.
By automating data connections, standardizing visualizations, and enabling stakeholder access anytime, Looker Studio reporting systems transform Google Ads reporting from a time drain into a strategic asset that informs better decision-making.
Whether you’re an agency managing multiple clients, a freelancer trying to scale operations, or an in-house marketing team improving stakeholder communication, google ads reporting templates provide the foundation for professional, efficient reporting that stakeholders actually want to use.
Stop spending your evenings manually copying numbers into presentations. Start leveraging automated PPC reports that work while you sleep, refresh themselves with fresh data, and present your Google Ads performance in the best possible light.
Explore professional Looker Studio templates designed specifically for google ads reports and start transforming your reporting workflow today.