Key Takeaways
- Automate ROAS tracking by connecting ads to revenue sources
- Eliminate spreadsheet calculations with real-time Looker Studio integration
- Monitor multi-account performance with consolidated profit margin tracking
- Prioritize ROAS and CAC over vanity metrics
- Track long-term profitability with cohort and LTV analysis
Stop guessing if your Facebook Ads are profitable. Learn how professional marketers track real ROAS with automated dashboards that connect ad spend to actual revenue—no spreadsheets required.
Why I Built My First Facebook Ads Dashboard at 2 AM
A client’s late-night email demanded proof: “Are our Facebook Ads actually profitable?”
Ads Manager showed 2.4 million impressions, 47,000 clicks, 892 purchases, claiming 4.2X ROAS. But their Shopify revenue told a different story.
I spent three hours exporting CSVs, cross-referencing transactions, and building manual spreadsheets to reconcile the numbers.
Facebook Ads Manager wasn’t designed to answer “Are we profitable?” It displays conversions and platform-reported ROAS but doesn’t connect to actual revenue or account for profit margins.
By 2 AM, I had built my first facebook ads dashboard in Looker Studio. It automatically pulled ad spend from Meta’s API, connected to Shopify for real revenue data, and calculated true ROAS with custom attribution windows.
My client’s response: “This is exactly what I needed.”
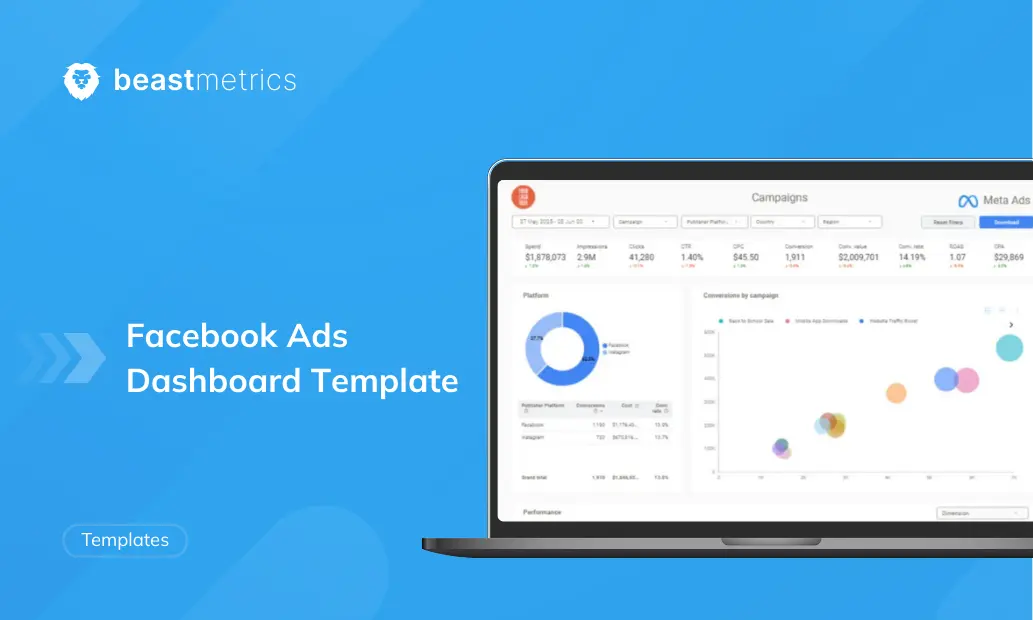
Professional facebook ads dashboard templates solve the disconnect between platform reports and actual profitability. A well-designed facebook ads looker studio template automatically integrates everything needed to answer the profitability question in seconds.
These meta ads looker studio template systems transform how agencies track campaign performance—moving from manual reporting to automated insights that drive better optimization decisions.
The Facebook Ads Manager Blind Spot
Platform-Reported ROAS vs. Reality
Facebook Ads Manager displays a “Purchase ROAS” metric that reflects conversions within a specific window (typically 7-day click, 1-day view), valued at whatever conversion value you’ve configured.
The problem: Platform-reported ROAS rarely matches actual business profitability.
Your Ads Manager shows 5X ROAS on a campaign spending $10,000, suggesting $50,000 in revenue. But when you check actual sales data:
- Some purchases came from customers who would have bought anyway
- Conversion values don’t account for product costs, shipping, or refunds
- Multi-touch customer journeys credit Facebook for sales influenced by other channels
- Attribution windows create reporting lag
According to Facebook’s official attribution documentation, understanding attribution windows is critical for accurate ROI measurement.
Studies show 63% of marketers struggle to accurately measure Facebook Ads ROI due to these complexities.
The Multi-Account Management Challenge
Managing Facebook Ads for multiple clients becomes exponentially more complex. You can’t easily:
- Compare performance across accounts without manually switching views
- Consolidate spending and ROAS for portfolio-level reporting
- Track agency-wide trends or optimization patterns
- Generate client-ready reports without hours of screenshot compilation
A facebook ads looker studio template transforms this. Instead of logging into individual ad accounts and copying numbers into slides, you build one centralized dashboard that automatically refreshes with all accounts’ data.
What Makes a Professional Facebook Ads Dashboard Different
Beyond Metrics: The Revenue Connection
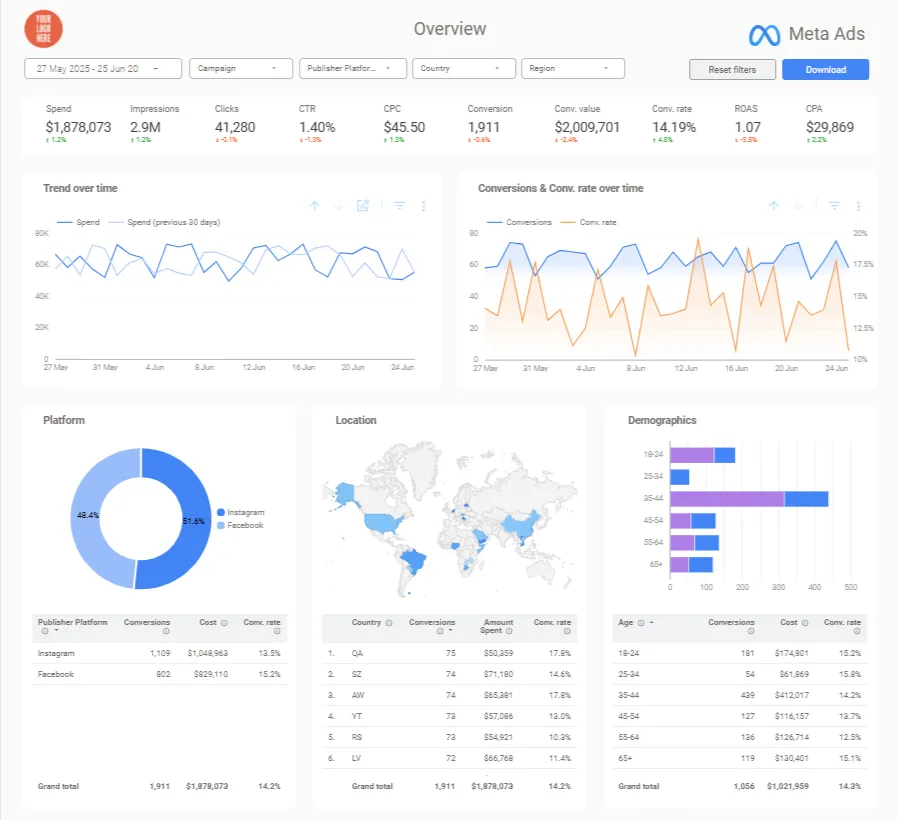
A professional facebook ads dashboard connects ad performance to business outcomes through data integration:
Basic Dashboard (Ads Manager data only):
- Shows platform metrics (impressions, clicks, CPC, CTR)
- Displays Facebook-attributed conversions
- Reports platform-calculated ROAS
- Limitation: Can’t verify actual revenue or profit
Professional Dashboard (Integrated data sources):
- Pulls ad spend from Meta Ads API
- Connects to Shopify, WooCommerce, or CRM for actual revenue
- Calculates true ROAS using real transaction values
- Accounts for product costs and profit margins
- Advantage: Shows genuine profitability per campaign
Research indicates companies integrating advertising data with revenue systems are 2.3x more likely to exceed their marketing ROI goals.
Essential Components of a ROAS-Focused Dashboard
When building facebook ads dashboard templates, prioritize these elements:
1. Real-Time Data Connection
Your dashboard should automatically refresh with the latest Meta Ads data—no manual exports required. Looker Studio’s native connector pulls data directly from Meta’s API with hourly refresh capabilities.
2. Revenue Integration Layer
Blend your ad data with actual sales records from your ecommerce platform. For ecommerce businesses, this means connecting Shopify, BigCommerce, or WooCommerce data to match orders with ad attribution.
3. Calculated ROAS Fields
Your dashboard should calculate multiple ROAS variations:
- Blended ROAS: Total revenue ÷ total ad spend
- First-purchase ROAS: Revenue from new customers only
- Lifetime value ROAS: Projected customer value over 12-24 months
- Profit-based ROAS: (Revenue minus COGS) ÷ ad spend
4. Attribution Window Controls
Toggle between different attribution windows (1-day, 7-day, 28-day click) or create custom windows matching your business model.
High-ticket products need extended windows; impulse purchases work with shorter ones.
Essential Metrics for Your Facebook Ads Dashboard
ROAS and Profitability Metrics
The top section of your facebook ads reporting dashboard should answer: “Are we making money?”
- Return on Ad Spend (ROAS)
The fundamental profitability indicator. Display this as a scorecard with conditional formatting—green for ROAS above break-even, red for campaigns losing money.
Calculate it as: (Attributed Revenue ÷ Ad Spend) × 100%.
- Cost Per Acquisition (CPA)
How much you’re paying to acquire each customer. Compare this against customer lifetime value to determine campaign sustainability.
If your CPA is $75 but your average customer generates $250 in profit over their lifetime, you have room to scale.
- Break-Even ROAS
Your break-even ROAS = 1 ÷ profit margin.
If your profit margin is 40%, your break-even ROAS is 2.5X—any campaign below this loses money, even if Facebook reports conversions.
- Net Profit from Ads
Revenue minus ad spend minus cost of goods sold. This is the number that actually matters.
A campaign with 10X ROAS selling $5 products with $4 production costs might generate less profit than a 3X ROAS campaign selling $100 products with $20 production costs.
Campaign Performance Metrics
These metrics help you understand why your ROAS is what it is:
- Click-Through Rate (CTR)
Industry benchmarks hover around 0.9% for Facebook Ads. Show CTR trends over time to identify creative fatigue—when CTR drops 20-30%, refresh your ads.
- Cost Per Click (CPC)
Track CPC by campaign, ad set, and individual ads. Rising CPCs signal increased competition for your target audience or declining ad relevance scores.
- Purchase Conversion Rate
The percentage of clicks that become purchases. This exposes landing page issues that Facebook optimization can’t fix.
If your CTR is strong but conversion rate is weak, the problem isn’t your ads—it’s your landing page or checkout flow.
- Frequency
How many times the average user sees your ad. High frequency (above 3-4) correlates with creative fatigue and declining performance.
Audience and Creative Performance
Advanced meta ads looker studio template setups segment performance by multiple dimensions:
- Performance by Audience Segment
Break down ROAS by interest-based audiences, lookalike percentages, custom audiences, and retargeting segments.
You’ll often discover that 20% of your audiences generate 80% of your profitable conversions.
- Creative Asset Analysis
Track which ad formats (carousel, video, static image), copy angles, and visual themes drive the best ROAS.
Include video completion rates and engagement rates to predict which creatives will maintain performance as spend scales.
- Device and Placement Breakdown
Mobile vs. desktop performance can vary dramatically.
Many ecommerce advertisers find mobile drives more traffic at lower CPCs, but desktop converts at higher rates with better ROAS.
- Geographic Performance
State-level or country-level ROAS reveals expansion opportunities.
A campaign might show mediocre overall ROAS but exceptional performance in specific regions worth isolating into dedicated ad sets.
Building Your Facebook Ads Dashboard: Step-by-Step
Step 1: Connecting Facebook Ads Data to Looker Studio
Start by creating a new Looker Studio report at lookerstudio.google.com.
Click “Create” → “Data Source” → search for “Facebook Ads” in the connector gallery.
Authentication Process:
Select the Facebook Ads connector. Looker Studio will prompt you to authenticate with your Facebook account that has admin access to the ad accounts you want to track.
Ad Account Selection:
After authentication, you’ll see a list of all ad accounts you have access to.
For agency dashboards tracking multiple clients, create separate data sources for each ad account or use Facebook Business Manager’s aggregated reporting.
Configuration Settings:
- Set your default date range (“Last 28 days” works well)
- Enable automatic data refresh (every 12 hours is sufficient)
- Configure currency settings to match your ad account’s reporting currency
Pro tip: If you’re managing dozens of ad accounts, consider using a meta ads template that’s pre-configured with standard dimensions and metrics—this saves hours of setup work.
Step 2: Integrating Revenue Data for True ROAS Calculation
This is where your dashboard evolves from reporting activity to measuring profitability.
You need to connect your actual sales data to calculate real ROAS.
For Shopify Stores:
Add a second data source using the Shopify connector. Install the Looker Studio app from the Shopify App Store and authenticate.
This connector pulls order-level transaction data including product revenue, order dates, and customer information.
For Other Ecommerce Platforms:
- WooCommerce: Use the WooCommerce connector or export to Google Sheets
- BigCommerce: Connect via native integration or Google Analytics 4 ecommerce tracking
- Custom platforms: Export transaction data to Google Sheets
Blending Facebook Ads Data with Revenue Data:
In Looker Studio, create a blended data source that joins your Facebook Ads metrics with revenue records.
The join key is typically the date dimension—matching ad spend on each day with revenue generated that day.
For more sophisticated attribution, pass Facebook’s fbclid parameter through to your order records and join on this ID for perfect attribution matching.
Step 3: Building ROAS Calculations with Custom Fields
Native Facebook Ads data doesn’t include your actual ROAS—you need to calculate it.
In Looker Studio, click “Add a field” to create calculated metrics:
Basic ROAS Formula:
Total Revenue / Amount Spent
This gives you a ratio like 4.2, representing $4.20 in revenue per $1 of ad spend.
Profit-Based ROAS:
((Total Revenue * Profit Margin) / Amount Spent)
Replace “Profit Margin” with your actual margin (e.g., 0.35 for 35% margin). This shows profitability rather than just revenue.
Break-Even ROAS Calculator:
1 / Profit Margin
Create this as a constant field. If your margin is 40% (0.40), your break-even ROAS is 2.5X.
Step 4: Designing Your Dashboard Layout for Maximum Impact
Dashboard design is about information hierarchy. Your layout should guide viewers to the most important insights first.
Top Section: Performance Scorecards
Create large scorecards displaying:
- Total ROAS (with conditional coloring—green if above break-even, red if below)
- Total ad spend
- Total revenue attributed
- Number of purchases
- Cost per acquisition
Middle Section: Trend Visualizations
Add time-series line charts showing:
- ROAS trend over time (daily or weekly granularity)
- Ad spend and revenue on dual-axis chart
- CPC and CTR trends to identify creative fatigue
Bottom Section: Performance Tables
Include detailed tables breaking down:
- Campaign-level performance with ROAS, spend, revenue, purchases
- Ad set performance with audience segments
- Geographic breakdown by state or country
Filter Controls:
Add date range selectors and campaign filters at the top so viewers can drill into specific time periods or campaign categories.
Mobile Optimization:
Many clients review dashboards on phones. Use Looker Studio’s mobile layout editor to ensure your most critical metrics remain visible on smaller screens.
Advanced ROAS Tracking Strategies
Multi-Touch Attribution: Understanding the Full Customer Journey
Facebook’s last-click attribution gives all credit to the final ad interaction before purchase. But customer journeys are rarely that simple.
A typical path might look like:
- Customer sees Facebook ad → clicks → browses → leaves
- Three days later, clicks a Google search ad → adds to cart → abandons
- Receives remarketing email → clicks through Instagram ad → purchases
In this journey, Facebook initiated the relationship, Google captured mid-funnel intent, email re-engaged, and Instagram closed the sale.
Last-click attribution credits only Instagram, but all four touchpoints contributed.
Implementing First-Click and Last-Click Comparison:
Create separate calculated fields in your facebook ads dashboard templates for first-touch and last-touch attributed revenue.
This requires UTM parameter tracking across all channels and can be implemented using Google Analytics 4’s attribution modeling features blended into your Looker Studio dashboard.
According to Google’s guide on marketing attribution models, multi-touch attribution reveals that initial touchpoint channels (often social media) are undervalued by up to 40% in last-click models.
Practical Implementation:
If full multi-touch attribution feels overwhelming, start simpler: Track “new customer ROAS” separately from “returning customer ROAS.”
This reveals whether Facebook is acquiring new customers or primarily converting people who already know your brand.
Cohort-Based ROAS Analysis: Tracking Long-Term Value
Monthly ROAS calculations hide an important truth: the true value of acquired customers unfolds over time.
A campaign might show 2X ROAS in month one, but if those customers repurchase at high rates, the actual ROAS might be 5X over 12 months.
Setting Up Cohort Tracking:
Organize customers by their acquisition date (the month they first purchased) and track their cumulative revenue over subsequent months.
Your dashboard should show:
- Month 0 ROAS (initial purchase)
- Month 1 ROAS (initial + first repeat purchase)
- Month 3 ROAS (cumulative through quarter)
- Month 6 ROAS (cumulative through half year)
- Month 12 ROAS (full first-year value)
This requires more sophisticated data infrastructure but the insights are transformative for subscription businesses, recurring purchase brands, and high-LTV products.
Lifetime Value Integration: The Ultimate Profitability Metric
Calculate predicted lifetime value (LTV) for customers acquired through Facebook Ads and compare it to acquisition cost.
LTV:CAC Ratio Benchmark:
A healthy LTV:CAC ratio is 3:1—each customer should generate three times their acquisition cost in profit.
Below 2:1 suggests poor unit economics; above 5:1 suggests you’re under-investing in growth.
Implementing LTV Tracking:
Create a calculated field that estimates customer lifetime value:
- Average order value × average purchase frequency × average customer lifespan
- Or use cohort-based actuals if you have sufficient historical data
Then calculate: LTV ÷ CPA. When this ratio exceeds 3:1, you have room to aggressively scale Facebook Ads spending.
Common Facebook Ads Dashboard Mistakes
Mistake #1: Trusting Platform ROAS Without Revenue Verification
I reviewed a client’s dashboard displaying 6X ROAS across all campaigns. When we connected their actual Shopify revenue, real ROAS was 2.3X—barely profitable.
The platform was double-counting conversions and hadn’t accounted for refunds.
The fix: Always connect real revenue sources. Platform metrics are directional, not definitive.
Mistake #2: Ignoring Profit Margins
A 4X ROAS sounds impressive until you realize you’re selling products with 15% profit margins.
At those margins, your break-even ROAS is 6.67X—that “profitable” 4X campaign is actually losing money.
The fix: Build break-even ROAS calculations into your dashboard and color-code campaigns accordingly.
Mistake #3: Tracking Too Many Vanity Metrics
Dashboards cluttered with impressions, reach, post engagement, and page likes distract from what matters: profitable customer acquisition.
These metrics have their place in awareness campaigns, but for direct-response ecommerce advertising, they’re noise.
The fix: Lead with ROAS, CPA, and profit metrics. Relegate vanity metrics to secondary pages or exclude them entirely.
Optimizing Campaigns with Dashboard Insights
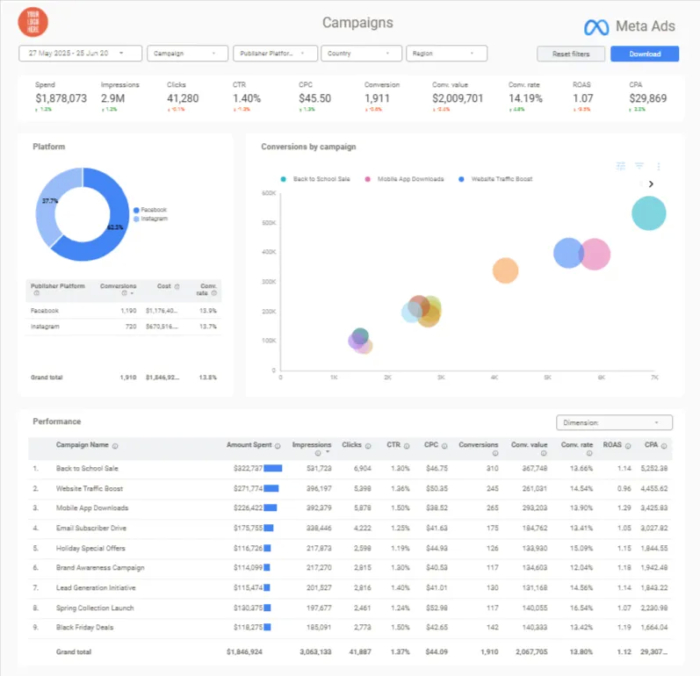
A dashboard’s value isn’t the metrics it displays—it’s the decisions it enables.
Scenario 1: Identifying Scale Opportunities
Your dashboard shows Campaign A generating 5.2X ROAS while spending $100/day, and Campaign B generating 2.1X ROAS at $500/day.
Campaign A is hitting its daily budget limit by 2 PM.
Action: Increase Campaign A’s budget to $300/day and monitor ROAS over the next week.
If ROAS remains above 4X, continue scaling. Reduce Campaign B’s budget or pause if ROAS stays below break-even.
Scenario 2: Detecting Creative Fatigue
Your dashboard’s CTR trend chart shows a campaign that started with 1.8% CTR four weeks ago now dropping to 0.7%.
Frequency has climbed from 2.1 to 4.7.
Action: Your audience has seen these ads too many times. Replace creative assets with fresh variations while maintaining the same targeting.
Research from Facebook’s creative best practices guide shows that rotating creatives every 2-3 weeks maintains 30% higher CTR than static creative approaches.
Scenario 3: Discovering Profitable Audience Segments
Your audience breakdown table reveals that broad targeting generates 3.1X ROAS, but a specific lookalike audience based on high-LTV customers generates 6.8X ROAS.
Yet it’s only spending $50/day due to Facebook’s automatic budget allocation.
Action: Create a dedicated campaign for this high-performing lookalike audience with its own budget rather than letting it compete with broader audiences in CBO.
This manual segmentation captures more volume from your best-performing audience before reaching saturation.
Conclusion
Professional Facebook Ads dashboards transform digital advertising’s core challenge: connecting what you spend to what you actually earn.
By automating ad performance integration with revenue sources and calculating profit-adjusted ROAS, these systems turn Facebook Ads into predictable growth engines.
Start with the fundamentals: connect ad data, integrate revenue sources, calculate true ROAS, and visualize your most profitable campaigns.
The dashboard I built at 2 AM wasn’t perfect, but it answered the question that mattered—and yours can too.