Highlight
- Save 16+ Hours Weekly: Automated Google Data Studio dashboard creation eliminates manual reporting tasks for agencies
- 600+ Data Connectors: Connect virtually any data source to your dashboard google data studio setup
- Zero Programming Required: Build professional data studio seo dashboard reports without technical expertise
- Real-Time Client Transparency: Interactive google data studio reports keep stakeholders informed with live data
- Cost-Effective Solution: Free platform beats expensive BI tools costing thousands monthly per user
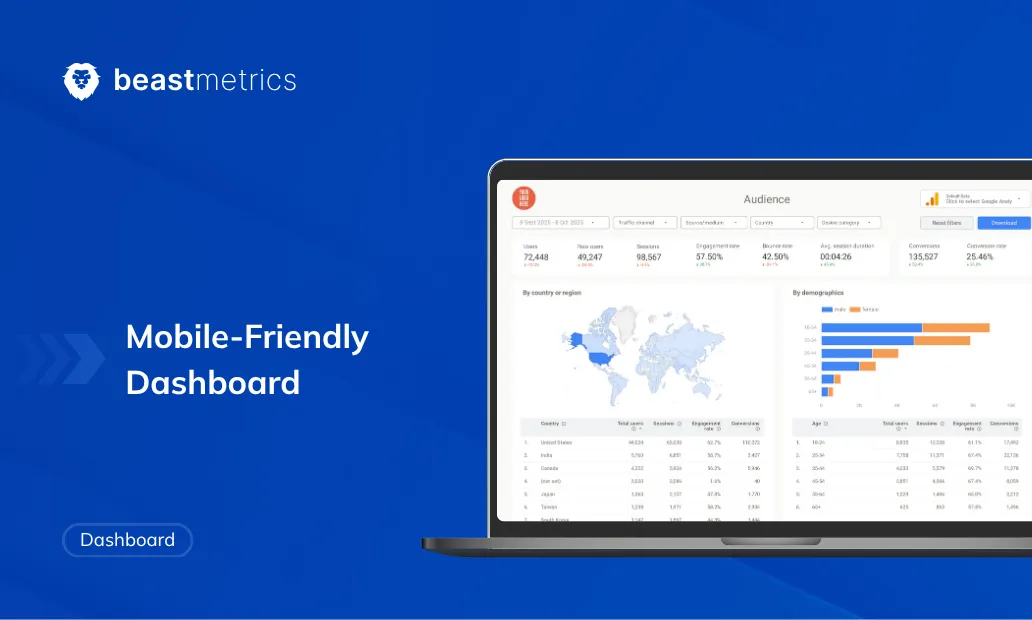
- Mobile-Responsive Design: New 2025 features ensure perfect viewing across all devices for google data studio for agencies
Tired of spending entire weekends wrestling with client reports? You’re not alone. 89% of agencies struggle with manual reporting that drains 20+ hours monthly from strategic work.
Digital marketing agencies face a brutal reality: clients demand transparent reporting, but creating those reports manually is a productivity killer. Enter Google Data Studio dashboards—the free solution that’s revolutionizing how smart agencies deliver insights.
This isn’t just another tool tutorial. We’re diving deep into how Google Data Studio dashboards can transform your agency’s reporting workflow, complete with real-world strategies that actually work.
Quick Answer:
A Google Data Studio dashboard (now Looker Studio) transforms raw marketing data into interactive, customizable google data studio reports that save agencies 16+ hours weekly through automated data visualization, multi-source integration, and client-ready presentations without programming knowledge.
What Is Google Data Studio? The Reality Behind the Hype
The Simple Truth About Google Data Studio (GDS)
Here’s what most agencies miss: what is data studio google isn’t just another reporting tool—it’s your ticket to reclaiming those lost weekends spent wrestling with client reports.
Launched in 2016 as part of Google’s Analytics 360 Suite, this web-based platform was designed with one goal: making data accessible to everyone, not just the data scientists. The platform democratizes reporting by allowing agencies to create interactive dashboards without touching a single line of code.
But here’s where it gets interesting: over 600 partner connectors enable connections to virtually any data source your clients use. This means your Google Data Studio dashboard isn’t limited to Google’s ecosystem—you can pull data from Facebook Ads, HubSpot, Shopify, and hundreds of other platforms for comprehensive google data studio for agencies solutions.
Key Features That Actually Matter for Agencies
Custom Branding Control: Your Google Data Studio dashboard maintains your agency’s professional appearance across all client reports. No more generic templates that scream “I used a free tool.”
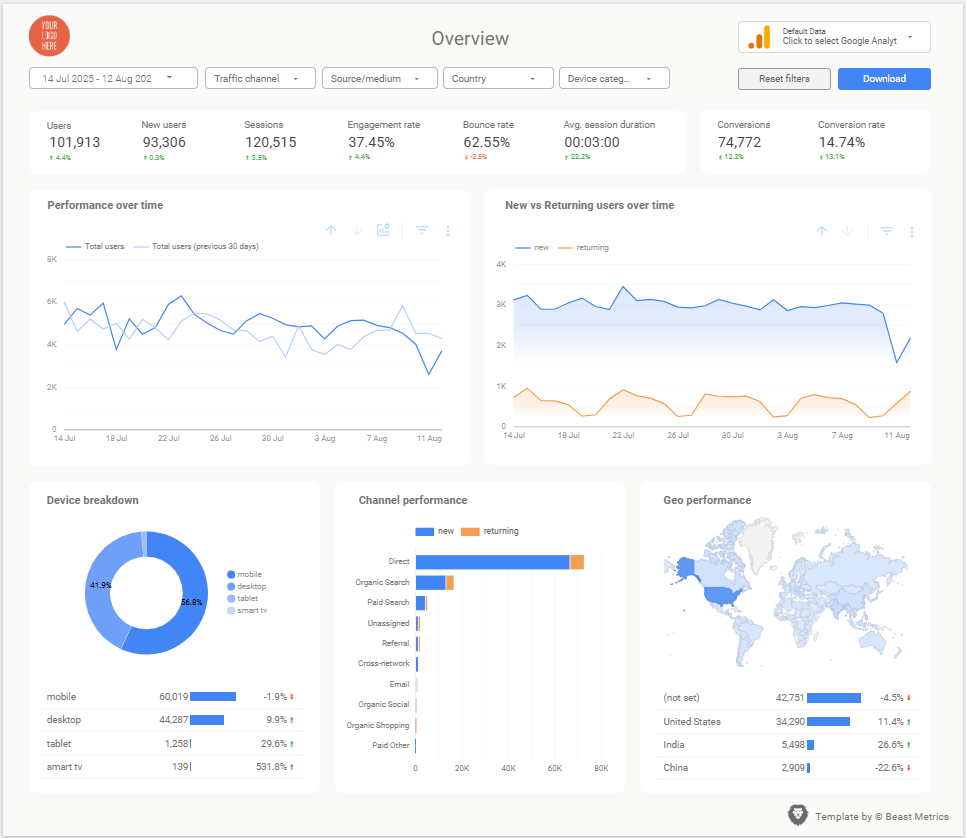
Multi-Source Data Integration: Unite Google Analytics, Google Ads, Search Console, and third-party platforms in a single google studio visual streaming interface. Your clients see the complete picture, not fragmented data silos.
Interactive Elements: Date selectors, campaign filters, and device breakdowns transform static reports into dynamic exploration tools. Clients can dig deeper into their data independently, reducing those “can you show me the mobile numbers for last quarter?” emails.
Automated Scheduling: Set up weekly or monthly email deliveries that arrive in client inboxes automatically. Your reporting becomes background magic instead of last-minute panic.
Common Misconceptions That Cost Agencies Money
Misconception #1: “All connectors are free” Reality: Only 20 of 620 connectors are actually free—those are Google’s native integrations. The rest require paid partnerships, which can add up quickly for multi-platform agencies.
Misconception #2: “Real-time updates happen instantly” Reality: Most data refreshes occur every 12-24 hours automatically. True real-time capabilities have limitations and caching delays that agencies need to plan around.
Why Smart Agencies Choose Google Data Studio Dashboards
Efficiency: Your Time is Worth More Than Manual Reports
The math is simple: If you’re spending 8 hours per week per client creating manual reports, and you have 10 clients, that’s 80 hours monthly. At $100/hour (conservative for agency work), you’re losing $8,000 monthly to manual labor.
Live data sync eliminates the export-compile-format-send cycle entirely. When your data sources refresh, your dashboard google data studio automatically updates. Scheduled email reports deliver directly to stakeholder inboxes weekly or monthly, without lifting a finger.
The Interactive advantage means fewer follow-up requests. When clients can filter by date ranges, campaigns, or traffic sources themselves, your team focuses on strategy instead of data manipulation.
Transparency: The Client Trust Builder You’ve Been Looking For
Research shows 92% of marketers say well-designed data presentations improve decision-making. But here’s what that statistic doesn’t tell you: clients who understand their ROI at first glance become long-term partners, not project-based relationships.
Visual dashboards communicate performance more effectively than spreadsheets ever could. Your google data studio reports tell stories, not just display numbers. When a client sees their organic traffic trending up while paid costs decrease, they understand value immediately.
“Interactive dashboards transformed our client relationships. Instead of explaining what the numbers mean, we now discuss what actions to take next.” – Sarah Chen, Digital Marketing Director at Scale Digital
Interactive filters democratize data access across client teams. Marketing managers, executives, and stakeholders can all explore the same dashboard with different perspectives, reducing confusion and improving buy-in.
Flexibility: Adapt to Every Client’s Unique Needs
No two agencies serve identical clients, and no two clients have identical goals. Your data studio seo dashboard framework evolves with changing needs—whether that’s tracking AI Overviews impact for SEO clients or monitoring ChatGPT-related search terms.
Responsive layouts work flawlessly across desktop, tablet, and mobile devices. New 2025 features enhance mobile viewing experiences, crucial as more executives review performance on their phones during commutes.
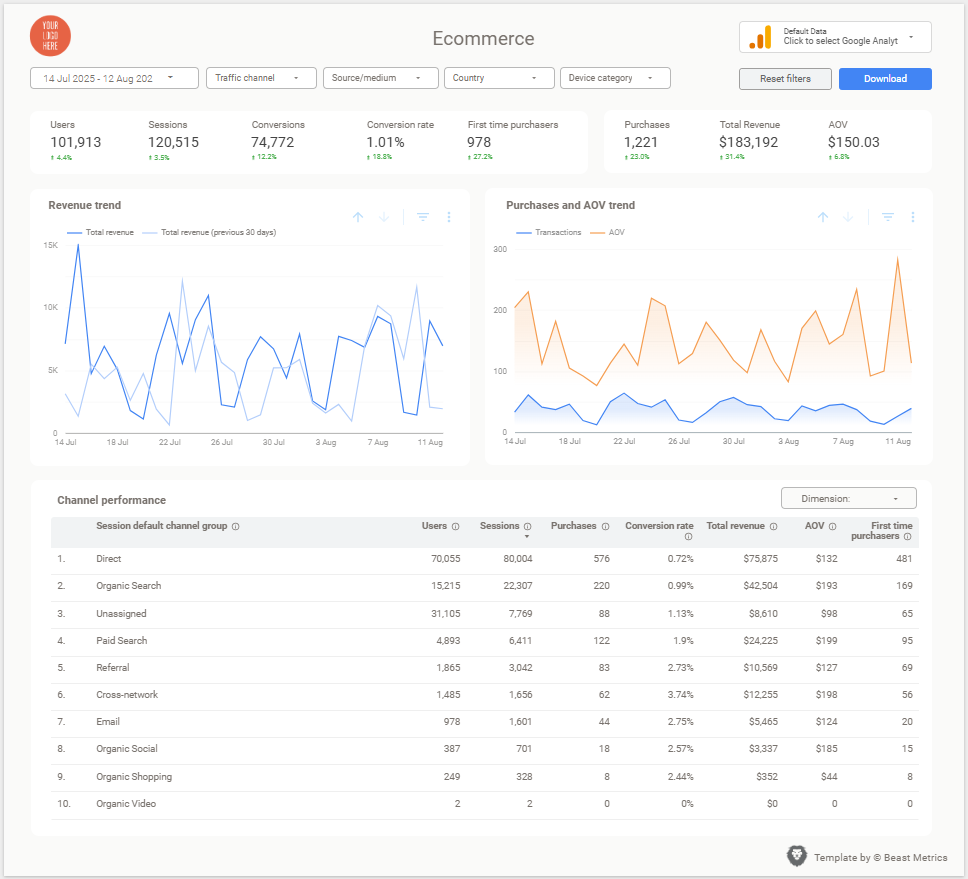
Create tailored stories for each client’s industry vertical. E-commerce clients need conversion funnels and AOV tracking. Lead generation clients focus on cost-per-lead and qualification rates. Service businesses prioritize local search visibility and phone call tracking.
Cost-Effective: Free Platform vs Enterprise Pricing
Enterprise BI tools often cost $2,000+ monthly per user. For a 5-person agency, that’s $120,000 annually before adding client seats. Google Data Studio’s free access makes powerful reporting accessible regardless of agency size.
Budget-conscious agencies benefit from seamless Google ecosystem integration. Native connectors for Analytics, Ads, and Search Console work accurately and reliably. Additional connector costs remain manageable compared to enterprise alternatives—typically $50-200 monthly versus thousands.
Primary Components of High-Performing Google Data Studio Dashboards
Data Sources Your Agency Should Prioritize
Google Analytics: Website traffic, conversion paths, audience behavior, and goal completions form the foundation of most client reports.
Google Ads: Campaign performance, keyword rankings, ad spend efficiency, and conversion tracking provide paid media insights.
Google Search Console: SEO rankings, search visibility, click-through rates, and technical issues complete the organic picture.
Third-Party Integrations: Facebook Ads, LinkedIn campaigns, HubSpot CRM data, and Shopify e-commerce metrics require connectors but provide comprehensive cross-platform analysis. Popular solutions include Supermetrics and Porter for multi-platform data aggregation.
Visual Types That Drive Action (Not Confusion)
Time Series Charts: Display trends over selected periods, making seasonality and campaign impact immediately visible.
Comparison Charts: Bar and pie visualizations compare performance across campaigns, channels, or time periods without overwhelming detail.
Geographic Visualizations: Geo maps reveal regional performance opportunities, particularly valuable for local businesses and multi-location clients.
Scorecard Highlights: Primary KPIs with comparison data enable quick executive-level understanding without diving into details.
Detailed Tables: Provide precise values when stakeholders need exact numbers for budget planning or performance analysis.
Interactive Features That Reduce Client Calls
Date Range Controls: Enable flexible time period analysis without creating separate reports for different timeframes.
Campaign Filtering: Help clients focus on specific initiatives, products, or service lines independently.
Device Breakdowns: Separate mobile, desktop, and tablet performance insights for optimization decisions.
Traffic Source Filters: Distinguish organic, paid, social, and direct traffic performance for budget allocation discussions.
Step-by-Step Guide: Creating Your First Agency Dashboard
1. Account Setup and Template Selection
Visit lookerstudio.google.com and sign in with Google credentials. Choose from over 80 free marketing templates or start from scratch—templates save 4-6 hours of initial setup time for common agency use cases.
Select responsive layout design for mobile-friendly dashboards. This choice affects how components arrange automatically across devices, crucial for executive mobile viewing.
2. Multi-Source Data Integration
Click “Add Data” and connect your primary sources. Google integrations authorize instantly through proper account permissions. Third-party connectors may require separate subscriptions—test connections before building extensive visualizations.
Pro tip: Connect data sources in order of importance. Start with Google Analytics for foundational metrics, add Google Ads for paid performance, then layer in additional platforms.
3. Template Optimization for Your Service Focus
SEO Agencies: Choose keyword ranking dashboard templates with Search Console integration for position tracking and click-through analysis.
PPC Specialists: Select Google Ads performance templates featuring cost-per-acquisition, quality scores, and auction insights.
Social Media Teams: Templates tracking engagement rates, reach metrics, and cross-platform performance comparisons.
E-commerce Focused: Conversion rate optimization templates monitoring AOV, cart abandonment, and revenue attribution.
4. Brand Customization That Reinforces Professionalism
Upload client logos and apply brand color schemes consistently. Endless customization options create engaging, professional dashboards that reinforce agency value.
Font selection should match client brand guidelines when possible. Consistent typography builds trust and demonstrates attention to detail.
Limit chart types to 2-3 per dashboard for visual consistency. Too many visualization styles create confusion rather than clarity.
5. Interactive Controls That Empower Clients
Date range controls enable various time period comparisons without separate report requests. Campaign selectors help clients focus on specific initiatives independently.
Geographic filters benefit local business clients significantly. Traffic source filters distinguish organic versus paid performance for budget discussions.
Device breakdowns separate mobile and desktop insights, crucial for responsive design and mobile optimization decisions.
6. Sharing and Collaboration Setup
Sharing permissions work like Google Docs: grant view access to clients, edit access to team members. Set up automated email deliveries matching client reporting cycles—weekly for active campaigns, monthly for strategic reviews.
Embedding options allow placement in client portals or websites. PDF exports provide static versions for presentations and executive meetings.
7. Automated Reporting Schedules
Scheduled email reports deliver automatically to stakeholder inboxes. Choose delivery frequency matching client needs—daily for time-sensitive campaigns, weekly for optimization cycles, monthly for strategic planning.
Set up multiple schedules for different stakeholder groups. Executives might receive monthly summaries while marketing managers get weekly detailed reports.
Advanced Applications and Pro Tips
Leveraging Google Studio Visual Streaming for Real-Time Insights
Real-time capabilities enable current data monitoring for fast-paced campaigns. PPC campaigns benefit from near-live performance tracking, allowing quick budget reallocation or bid adjustments.
Social media advertising requires rapid optimization responses. Set refresh schedules matching campaign monitoring needs—hourly for active tests, daily for standard monitoring.
Apply data source filters before blending for better performance. Shorter date ranges improve loading speeds significantly when dealing with large data volumes.
Building Effective Data Studio SEO Dashboards
SEO dashboards should tell compelling optimization stories. Impressions provide early success signals before rankings improve. Click-through rates demonstrate content relevance to search queries.
Keyword ranking tables form SEO reporting foundations. Summary scorecards compute automatically from detailed keyword data. Position tracking over time reveals optimization impact and competitive changes.
Multi-Channel Overview Dashboards for Complete Attribution
Data blending combines multiple sources into unified metrics. Total ROAS calculations include Google Ads, Facebook spend, and other platform costs. Cross-channel attribution shows complete customer journey paths.
Unified spend tracking reveals budget allocation effectiveness across platforms. Combined conversion data provides accurate ROI calculations for strategic planning.
Google Data Studio vs. Competition: Making the Right Choice
Honest Strengths and Limitations
Strengths include:
- Free access with robust Google integration
- Interactive, real-time updates versus static reports
- Template availability accelerating dashboard creation
- Familiar Google interface reducing learning curves
Limitations to consider:
- Third-party connector costs accumulate with platform diversity
- 50 components per page limit restricts complex visualizations
- Internet connection requirements prevent offline work
- Limited advanced analytics compared to enterprise solutions
Decision Framework for Agencies
Choose Google Data Studio when:
- Client budgets prioritize cost-effectiveness over advanced features
- Google ecosystem dominates client marketing stacks
- Startup agencies need professional reporting without enterprise costs
- Interactive reporting provides significant value over static alternatives
Consider dedicated tools when:
- Managing 20+ clients across diverse platform combinations
- Advanced attribution modeling becomes business-critical
- Custom data transformation requirements exceed Google’s capabilities
- Enterprise-level security and compliance requirements apply
As industry expert Sarah Johnson from MarketingProfs notes, “Google Data Studio democratizes data visualization, making professional reporting accessible to agencies of all sizes” while maintaining enterprise-level functionality.
Transform Your Agency Reporting Today
Google Data Studio dashboards empower agencies to deliver transparent, professional reporting that builds long-term client relationships. Interactive visualizations drive smarter business decisions while automation saves countless hours previously lost to manual reporting tasks.
The combination of free access, seamless Google integration, and extensive customization capabilities makes Google Data Studio essential for modern agencies. Professional presentations demonstrate agency value while real-time data keeps stakeholders informed and engaged.