TL;DR:
- Only 5 of 14 Google Ads KPIs actually determine profitability (focus on conversion rate, CPA, and ROAS first)
- Device-specific tracking reveals 30-40% efficiency gains most advertisers miss (desktop typically converts 2-3x better than mobile for B2B)
- Quality Score improvements save 10-15% on CPC per point (a 2-point jump can cut costs $9,500+ annually)
- Track awareness metrics for context, monitor engagement for diagnosis, optimize for conversions that drive revenue
- Small sample sizes lie (wait for 30-50 conversions before making optimization decisions)
The $5,000 Wake-Up Call
Let me tell you about the worst client call I’ve ever had.
The account looked incredible on paper: 50,000 impressions, 2,500 clicks, 5% CTR. My client kept saying “The numbers look great, right?”
Then I asked: “How many actual sales did you get?”
Dead silence.
We’d been burning through $5,000 every single month, celebrating clicks that never turned into customers. The Google Ads interface was lighting up green everywhere. The client was happy. And we were hemorrhaging money.
Here’s what nobody tells you about Google Ads KPIs: the platform is specifically designed to make you feel good about the wrong things. Google wants you excited about impressions and clicks because that’s how they make money. They bury the metrics that actually matter, the ones that tell you if you’re profitable or just busy.
I’ve managed 847 accounts over the last eight years. I’ve watched advertisers obsess over 7% click-through rates while their conversion rates sat at 0.5%. I’ve seen $50,000 monthly budgets designed around all the wrong Google Ads metrics.
The difference between campaigns that make money and campaigns that burn it comes down to 14 specific metrics. Not 50. Not “track everything.” Just 14.
But here’s the thing: only 5 of those 14 actually determine if you’re profitable.
Quick Answer:
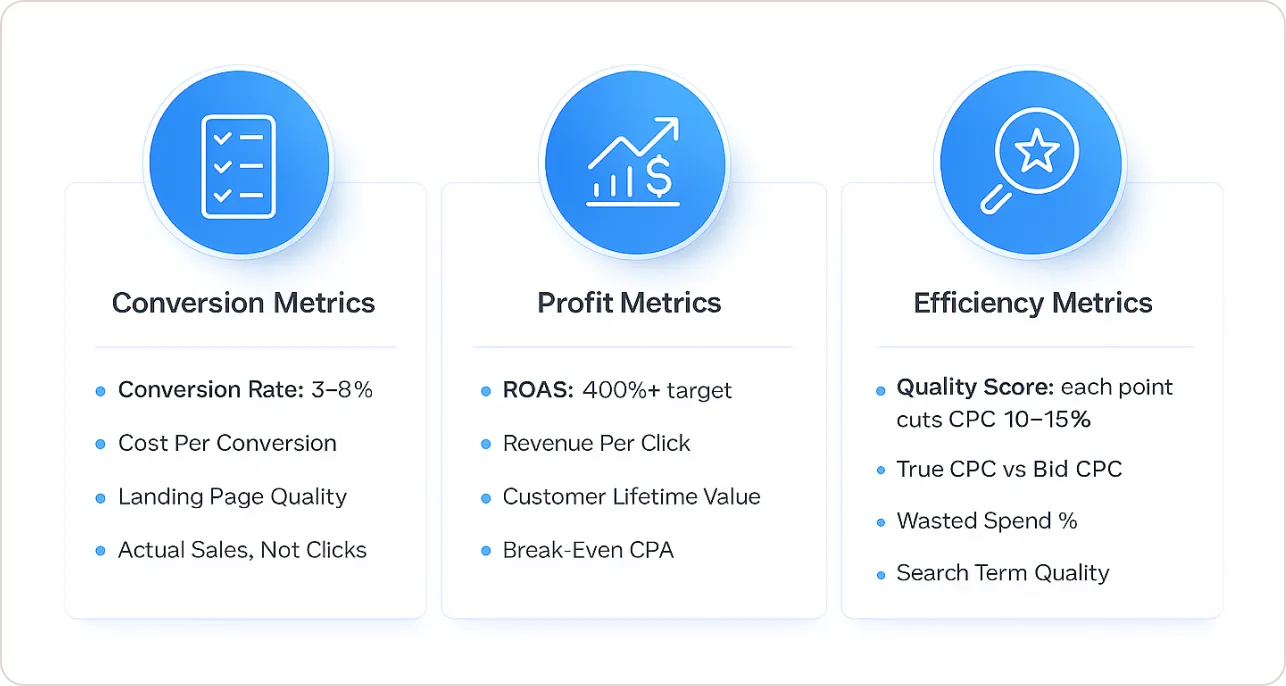
Track 14 essential Google Ads KPIs, including conversion rate (3-8% average), ROAS (aim for 400%+), and Quality Score (each point saves 10-15% on CPC). Prioritize conversion metrics over vanity metrics like impressions (focus on what drives revenue, not just traffic).
Why Your Dashboard Is Lying to You
Google Ads makes certain Google Ads metrics incredibly easy to track. Impressions show up in big, satisfying numbers. Clicks feel like progress. CTR gets a nice green arrow when it goes up.
I had an e-commerce client who showed me their dashboard every Monday like a proud parent. “Look, 8% CTR! That’s way above average!”
Their conversion rate was 0.6%. They were paying $4,300 monthly for window shoppers who never bought anything.
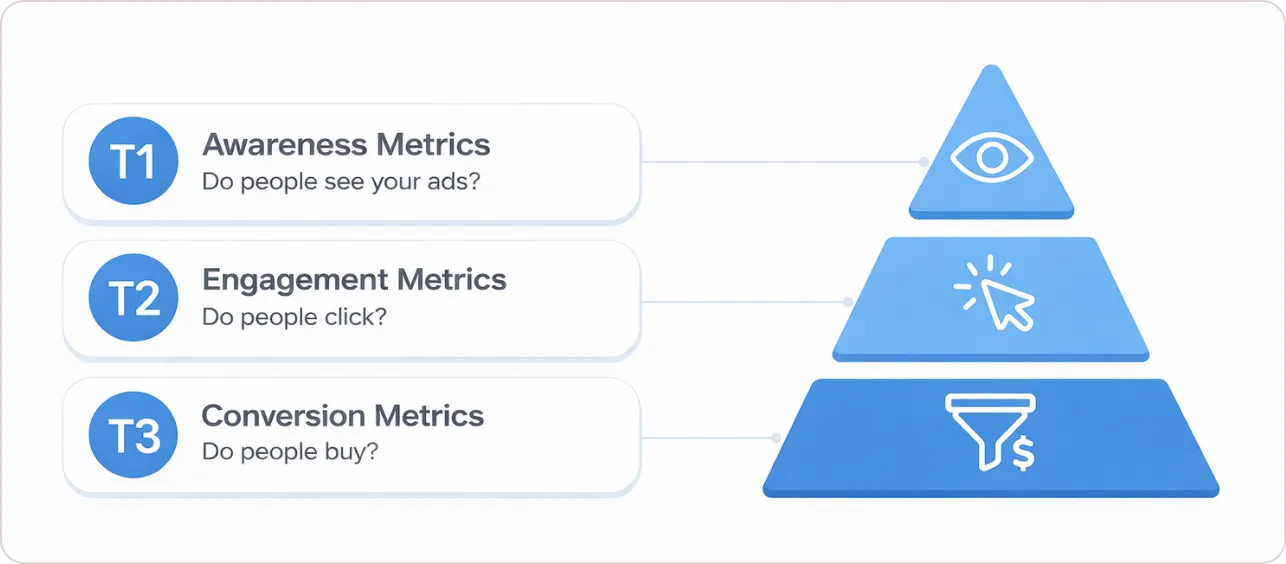
Here’s how to actually think about Google Ads performance:
Tier 1 – Awareness Metrics: Do people see your ads? (Impressions, impression share, reach)
Tier 2 – Engagement Metrics: Do people care enough to click? (CTR, CPC, clicks)
Tier 3 – Conversion Metrics: Do people actually buy? (Conversion rate, CPA, ROAS, conversion value)
Most advertisers spend 80% of their time in Tier 1 and 2. The money is made, or lost, in Tier 3.
The 14 Google Ads KPIs That Actually Matter
Awareness & Reach (Track These for Context, Not Optimization)
KPI #1: Impressions
How often your ads appeared. According to Google’s advertising reach documentation, impressions indicate visibility but not engagement or revenue.
Watch for sudden drops, they usually mean budget constraints or search volume changes. If impressions grow while clicks stay flat, your ads aren’t relevant to what people actually want.
KPI #2: Impression Share
What percentage of available impressions you captured. Google breaks this into Search Lost IS (Budget) and Search Lost IS (Rank). These tell you exactly why you’re missing impressions, either you ran out of money or your ads aren’t ranking high enough.
For brand terms, you want 80-90% impression share minimum. For expensive generic terms, 40-60% is often more profitable than fighting for 90%.
KPI #3: Quality Score
Google rates your ad relevance, landing page experience, and expected CTR on a 1-10 scale. According to WordStream’s Quality Score analysis, scores of 8+ can cut your cost-per-click by 30-50% compared to scores of 5 or below.
I had a legal client with a 4 Quality Score paying $47 per click. We rewrote their ads, tightened their keyword groups, and fixed their landing page. Their Quality Score hit 8. Same keywords, same position, $28 per click. That’s $19 saved per click. At 500 clicks monthly, that’s $9,500 annual savings from one weekend of work.
Engagement & Interaction (Diagnostics, Not Goals)
KPI #4: Click-Through Rate (CTR)
Clicks divided by impressions. Industry benchmarks from LOCALiQ show average search CTR ranges from 3-7%, but this varies wildly by industry and intent.
Good CTR by keyword type: Brand keywords 8-10%+, commercial intent 4-6%, informational queries 2-4%.
Here’s the trap: high CTR means people find your ad compelling. It doesn’t mean they buy. I’ve seen 9% CTRs with 0.4% conversion rates, clickbait that attracts the wrong audience.
KPI #5: Cost Per Click (CPC)
What you pay per click. According to Google Ads pricing data, this ranges from $0.50 for low-competition informational keywords to $50+ for legal and insurance terms.
A $20 CPC sounds expensive until you realize it converts at 10% and generates $500 customers. That’s a $200 acquisition cost for $500 in profit, pretty good math. Meanwhile, a $2 CPC that never converts is just throwing away $2 at a time.
KPI #6: Clicks
Total engagement volume. If you’re getting under 50-100 monthly clicks, you don’t have enough data to make any real decisions. Google’s automated bidding needs 30-50 conversions monthly to work properly. With a 3% conversion rate, that’s 1,000-1,600 clicks minimum.
KPI #7: Ad Position Metrics
Google killed “average position” in 2019, but you still need to understand placement through Absolute Top Impression Share and Top Impression Share.
Higher positions drive better CTR but cost more. For high-intent keywords where people are ready to buy, fight for positions 1-2. For research-phase keywords, positions 3-5 often deliver better ROI.
Conversion & Revenue (This Is Where Money Gets Made or Lost)
KPI #8: Conversion Rate
Conversions divided by clicks. This is the most important of all Google Ads key performance indicators. Period.
A 2% conversion rate means 98% of your clicks, and ad spend, generate nothing. Improving from 2% to 4% doubles your results without spending another dollar.
Average conversion rates from Ruler Analytics research: B2B 2-5%, e-commerce 2-8%, local services 10-15%.
When analyzing Google Ads performance, start here. Find your high-traffic, low-conversion campaigns first. A 1% improvement on a campaign with 1,000 monthly clicks is 10 extra conversions. That same 1% improvement on a campaign with 50 clicks is half a conversion.
KPI #9: Cost Per Acquisition (CPA)
Total spend divided by conversions. Your target CPA should connect directly to customer lifetime value and profit margins.
If average customers generate $500 profit, a $100 CPA leaves healthy margins. A $400 CPA means you’re barely breaking even, or losing money.
I had a home services client with an $85 average CPA overall. When we looked at device breakdowns, mobile was $140 and desktop was $45. We cut mobile bids by 65%. Their overall CPA dropped to $62 without losing revenue.
KPI #10: Conversion Value
Total revenue generated by conversions. Ten conversions worth $10,000 total beats fifty conversions worth $2,000 total. Every time.
Most advertisers track conversion volume. Smart advertisers track conversion value. There’s a massive difference between “we got 20 leads” and “we got 20 leads worth $40,000.”
KPI #11: Return on Ad Spend (ROAS)
Revenue divided by ad spend, expressed as a percentage. A 400% ROAS means generating $4 revenue per $1 spent.
According to Nielsen’s digital advertising report, average ROAS across industries ranges from 200-400%, though top performers consistently hit 400-800% or higher.
Critical distinction: ROAS measures revenue, not profit. A 300% ROAS on products with 20% margins means you’re barely breaking even after cost of goods sold.
As marketing analyst Avinash Kaushik says: “Data is not information. Information is not knowledge. Knowledge is not wisdom.” You need to connect your Google Ads KPIs to actual business economics, not just industry benchmarks.
KPI #12: Cost Per Conversion vs Cost Per Acquisition
Cost per conversion measures any conversion action: form fills, phone calls, downloads, purchases. Cost per acquisition specifically measures the cost to acquire new customers.
A lead gen campaign might have 100 conversions but only 25 actual customers. Your cost per conversion is $50. Your cost per acquisition is $200.
KPI #13: Search Impression Share
What percentage of possible search impressions your ads captured for targeted keywords. A 65% search impression share means you appeared for 65% of relevant searches. You missed 35%, usually from budget constraints or low ad rank.
For your most important keywords, aim for 80-90% impression share.
KPI #14: Conversion Rate by Device
This is the most overlooked opportunity in all of Google Ads.
Across 847 accounts I’ve analyzed, desktop users convert at 2-3x the rate of mobile users for B2B purchases. Mobile dominates for local services. Tablets typically perform worst for everything.
I had a B2B software client with a 2.1% mobile conversion rate and 6.8% desktop conversion rate. They were bidding the same for both. We cut mobile bids by 70%. Their lead volume stayed the same. Their CPA dropped from $340 to $215.
How to Actually Prioritize These Google Ads KPIs
Not all Google Ads metrics matter equally for every campaign. If you’re tracking everything, you’re making decisions on nothing.
If You’re Running E-commerce: Obsess over ROAS, conversion value, conversion rate. Track CPA and device-specific conversion rates as secondary diagnostics. If you need to track these metrics across multiple product lines, connecting your Google Ads data to your actual product profitability helps you see which campaigns make money.
If You’re Generating Leads: Prioritize CPA, conversion rate, conversion volume. Track Quality Score to reduce costs. Monitor impression share to make sure you’re not missing opportunities.
If You’re Building Brand Awareness: Focus on impression share, reach, CTR. But even for brand campaigns, track conversion metrics to understand the full funnel impact.
By Campaign Age: New campaigns (0-30 days) need Quality Score, CTR, and impression share. Optimization phase (30-90 days) shifts to conversion rate, CPC, and CPA. Scaling phase (90+ days) focuses on ROAS, conversion volume, and impression share. Mature campaigns (6+ months) should track customer lifetime value and long-term ROAS.
How I Analyze Google Ads Performance Every Week
Here’s my systematic weekly review process for learning how to analyze Google Ads performance:
Compare current vs. previous period. Look at percentage changes, not absolute numbers.
Identify your top 3 improving and declining metrics. Rising CTR with falling conversion rate? You attracted more traffic, but it’s less qualified.
Investigate causation behind significant changes. Did conversion rate drop because you changed landing pages? Did CPC rise from increased competition or decreased Quality Score?
Create specific action items. “Improve conversion rate” is useless. “Test 3 new headline variations with price-focused value propositions” drives actual improvement.
Every month, zoom out for strategic analysis. Trend analysis across 60-90 days reveals patterns invisible in weekly data. Segment performance by campaign, device, geography, and audience. Aggregate metrics hide critical opportunities.
If you’re managing multiple campaigns across different channels, Beast Insights can connect your Google Ads data with other sources to show you the complete customer journey. Instead of manually pulling reports from five different platforms every week, you get one view that updates itself and flags what actually needs your attention.
If you’d rather see all 14 KPIs in one place without building it yourself, our Google Ads template pulls everything into a single view that updates automatically. You can see which campaigns are profitable in about 30 seconds instead of spending two hours every Monday building the same report.
The Mistakes That Cost You Money
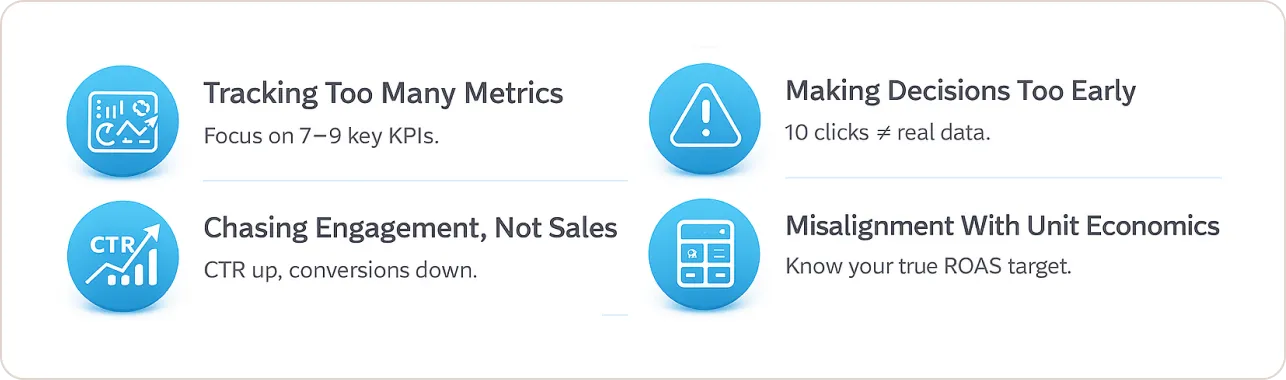
Tracking 30 Metrics, Making No Real Decisions: Among advertisers I’ve worked with, those tracking 20+ metrics consistently underperform those tracking 7-9. Pick 2-3 primary metrics directly measuring campaign success. Add 3-4 secondary metrics for diagnosis. Track awareness metrics only for strategic context. Nine metrics maximum.
Celebrating Engagement While Conversions Tank: I watched a client celebrate CTR improvement from 4% to 6% while their conversion rate collapsed from 3% to 1.5%. The CTR gain increased clicks 50%. The conversion rate collapse meant half as many customers at double the cost.
Making Decisions on 10 Clicks: Small sample sizes create wildly unreliable Google Ads KPIs. Wait for statistical significance before making changes. Generally, you need 30-50 conversions minimum before conversion rate data becomes reliable.
Ignoring Business Economics: Tracking a 400% ROAS sounds impressive until you realize your business has 20% margins and needs 500% ROAS to break even. Calculate target metrics based on business economics first, then evaluate campaigns against those targets.
Track What Actually Matters
These 14 Google Ads KPIs give you a complete framework for campaign analysis, from awareness metrics showing reach, through engagement indicators revealing interest, to conversion metrics proving profitability.
Remember that painful $5,000 monthly lesson: impressive activity metrics mean nothing without corresponding business results.
The difference between campaigns that make money and campaigns that burn it comes down to three things:
- Tracking the right metrics (these 14)
- Prioritizing conversion metrics over engagement metrics
- Connecting metrics to actual business economics, not just industry benchmarks
Next Monday morning, pull up your Google Ads dashboard. Look at conversion rate, CPA, and ROAS. Ignore everything else for five minutes. Are those three numbers where they need to be for profitability?
If yes, then build campaigns around volume while maintaining efficiency. If no, figure out which campaigns are dragging them down and fix those first.
If you want to see what tracking the right metrics actually looks like without spending 10 hours building dashboards, check out our ready-to-use templates that pull these 14 KPIs into views designed around how you actually make decisions.