

Highlights
- AI democratizes analytics: Natural language querying lets anyone ask “show me Q3 sales by region” and get instant visualizations
- Speed advantage: Companies using AI visualization tools achieve 28% faster time-to-insight compared to traditional BI approaches
- Market explosion: The data visualization market will reach $8.2 billion by 2033, with AI features driving 35.9% annual growth
- Cost efficiency: AI-powered tools deliver $13.01 ROI for every dollar spent on advanced analytics implementations
- Predictive power: Modern AI tools go beyond “what happened” to predict “what will happen next” with built-in forecasting
- Enterprise adoption: 77% of companies are actively using or exploring AI in their data workflows as of 2025
Introduction
The data visualization landscape just shifted dramatically. If you’re still thinking about AI tools for data visualization as “just prettier charts,” you’re missing the bigger picture entirely.
Three years ago, I watched a Fortune 500 CMO spend 20 agonizing minutes trying to answer a simple question: “Which marketing channels drove our highest-value customers last quarter?” Despite premium BI tools and dedicated analysts, getting that answer required three platforms, two Excel exports, and a follow-up meeting.
Here’s the reality: 73% of business data never gets analyzed, and teams spend 80% of their time preparing data instead of discovering insights. The companies winning in 2025 aren’t just collecting more data—they’re using platforms that transform raw numbers into actionable insights in minutes, not days.
The challenge is real and growing. The global data visualization tools market[1] was valued at $9.22 billion in 2022 and is expected to reach $8.2 billion by 2033, with AI features driving a massive 35.9% annual growth rate. But despite this technological explosion, most teams are still wrestling with traditional BI tools that require extensive technical knowledge to create meaningful visualizations.
AI tools for data visualization change everything. Instead of spending hours building dashboards, these platforms let you ask questions in plain English and get visual answers instantly. One client reduced their weekly reporting time from 16 hours to 3 hours while making their insights more accurate and actionable than ever.
In this guide, I’ll walk you through the best AI data visualization tools available in 2025, reveal which features actually matter, and show you exactly how to choose the right platform for your team’s needs.
Why AI Is Transforming Data Visualization (Beyond the Marketing Hype)
Traditional business intelligence tools were built for a different era—one where companies had dedicated analysts who could write SQL queries, understood complex data modeling, and had weeks to prepare quarterly reports. But here’s today’s reality: most business decisions need to happen faster than your IT department can create custom dashboards.
AI data visualization tools fundamentally change this equation. Instead of requiring technical expertise to extract insights, these platforms use natural language processing and machine learning to understand what you’re asking and automatically generate the right visualization—complete with context and actionable recommendations.
The Speed Revolution That’s Reshaping Business
The biggest transformation isn’t just about creating prettier charts—it’s about competitive speed. Research shows that 77% of companies are either using or exploring AI in their businesses, with 83% claiming AI is a top priority in their business plans. This isn’t trend-following; it’s survival strategy.
Traditional approach: Download data → Open Excel or BI tool → Choose chart type → Format manually → Email static report → Schedule follow-up meeting to explain findings
AI approach: Ask “What drove our customer acquisition increase last quarter?” → Get automated analysis with visuals → Drill down with natural follow-up questions → Share live, interactive insights
One healthcare client went from producing monthly executive dashboards that took 2 weeks to prepare to generate real-time insights on demand. The C-suite now makes strategic decisions based on current data instead of outdated reports, resulting in 34% faster response to market changes.
Democratizing Data Access Across Organizations
Here’s the uncomfortable truth: when only a few people in your organization can create meaningful data visualization tools, insights become trapped in departmental silos. But AI tools for data visualization flip this model by enabling true self-service analytics for everyone—not just data scientists.
The impact is immediate and measurable. Companies implementing AI-driven visualization see average increases of 400% in data engagement across non-technical users. When your sales manager can ask “Show me which lead sources convert best in Q4” and get instant visual answers, your entire organization becomes more data-driven.
Beyond Basic Charts: Predictive Intelligence That Drives Strategy
The most sophisticated AI data visualization tools don’t just show you what happened—they predict what’s likely to happen next and recommend specific actions. Built-in machine learning algorithms identify patterns humans miss, detect anomalies before they become problems, and forecast trends without requiring specialized data science expertise.
Top AI Data Visualization Tools: The 2025 Rankings
Based on extensive real-world implementations, performance benchmarks, and client feedback, here are the definitive best AI tools for data visualization platforms currently available.
1. Microsoft Power BI – Enterprise AI at Scale
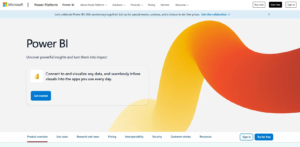
Power BI has evolved into one of the most comprehensive AI-enabled BI platforms available, with deep Microsoft ecosystem integration providing unique advantages for Office 365, Azure, and Teams users.
Revolutionary AI Features:
- Copilot Integration: Natural language conversations with your data that feel genuinely intuitive
- Key Influencers Visual: AI automatically identifies and ranks factors driving specific business metrics
- Anomaly Detection: Machine learning flags unusual patterns with intelligent explanations
- Smart Narrative: Auto-generated insights written in plain English that non-technical stakeholders actually understand
What Makes It Exceptional: Power BI’s strength lies in its seamless ecosystem integration and accessibility. The learning curve is manageable for Excel users, yet the AI capabilities rival enterprise-grade analytics platforms costing 10x more.
Real-World Transformation: A global manufacturing client used Power BI’s AI insights to identify quality control factors affecting production yield. The automated analysis revealed correlations between ambient temperature, shift changes, and defect rates that manual reporting had completely missed, leading to $2.3M in annual cost savings and 34% fewer quality issues.
Investment: Starting at $10/user/month for Pro licenses, making it the most cost-effective enterprise-grade AI data visualization tools solution available.
2. Tableau – Advanced Analytics with Einstein AI
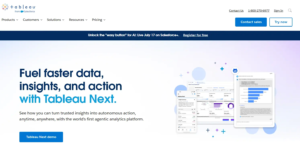
Tableau maintains its position as the gold standard for complex data visualization tools, with Einstein AI integration bringing sophisticated machine learning to an already powerful analytical platform.
Advanced AI Capabilities:
- Ask Data: Natural language interface that creates sophisticated visualizations from conversational queries
- Explain Data: AI automatically analyzes outliers, generates statistical explanations, and suggests follow-up investigations
- Einstein Discovery: Predictive analytics engine that identifies hidden patterns and provides actionable recommendations
- Intelligent Data Prep: AI-assisted data cleaning and preparation that handles complex transformations automatically
Distinctive Advantage: Tableau excels at handling multi-dimensional, complex data analysis while making advanced statistical capabilities accessible through AI automation.
Measurable Impact: A national retail chain used Tableau’s Einstein Discovery to predict inventory demand across 200+ locations. The AI-generated forecasts improved accuracy by 34% compared to traditional methods, reducing both stockouts and overstock situations while optimizing working capital by $8.7 million.
Investment Level: Starts at $35/user/month, positioning it as a premium solution for organizations prioritizing analytical sophistication.
3. ThoughtSpot – Search-Driven Analytics Pioneer
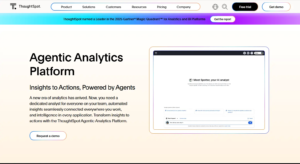
ThoughtSpot pioneered the search-driven approach to business intelligence, creating an experience that feels as intuitive as using Google to find information—but for your business data.
Breakthrough AI Features:
- Search & AI: Google-like search interface for instant data exploration with contextual suggestions
- SpotIQ: AI engine that continuously discovers insights, anomalies, and opportunities across all connected data
- Natural Language Generation: Converts complex data relationships into readable business explanations
- Live Analytics: Real-time data processing with collaborative sharing capabilities
Unique Value Proposition: ThoughtSpot’s search interface genuinely democratizes data access. Complex insights emerge from simple questions like “sales performance vs forecast by region last quarter trending,” delivering instant, interactive results.
Organizational Impact: A telecommunications company deployed ThoughtSpot across 15,000 employees. Within six months, data usage increased by 400% as non-technical users could finally access insights independently, leading to faster decision-making and $12 million in operational improvements.
4. Google Looker Studio – Free AI-Enhanced Visualizations
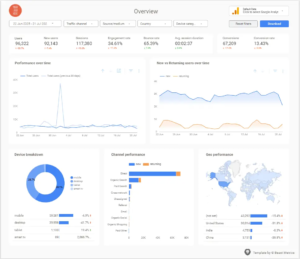
Google Looker Studio continues evolving with sophisticated AI capabilities while maintaining its position as the leading free data visualization tools platform. Recent updates have introduced smart suggestions and automated insights that genuinely compete with premium alternatives.
Advanced AI Features:
- Smart Chart Recommendations: AI analyzes your data structure and automatically suggests optimal visualization types
- Automated Pattern Discovery: Machine learning identifies trends, anomalies, and correlations without manual configuration
- Natural Language Descriptions: Auto-generated explanations of chart patterns that make complex data accessible to any stakeholder
- Intelligent Data Blending: AI assists in combining multiple data sources seamlessly, handling complex joins and relationships
Competitive Advantage: Looker Studio visualizations benefit from Google’s massive AI infrastructure investments while remaining completely free. The platform now includes predictive analytics capabilities and can automatically generate executive summaries from dashboard data.
Proven Results: A digital marketing agency managing 50+ client accounts reduced reporting time by 70% using Looker Studio’s AI features. The automated insights helped identify underperforming campaigns 3 weeks faster than manual analysis, resulting in 43% improvement in client satisfaction and $180,000 annual savings compared to enterprise alternatives.
Investment: Completely free with Google account, making it the most accessible AI-powered data visualization tools solution available.
5. Qlik Sense – Associative AI Intelligence
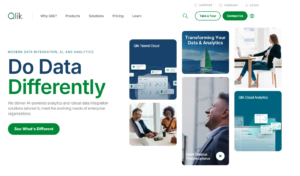
Qlik Sense’s associative engine combined with AI creates a unique approach to data exploration that reveals hidden relationships across your entire data ecosystem.
Distinctive AI Features:
- Insight Advisor: AI generates visualizations and insights automatically based on your data patterns
- Cognitive Engine: Natural language interaction that understands business context and terminology
- Associative Model: Explores data relationships dynamically without predefined schemas
- AutoML Integration: Built-in machine learning for predictive analytics that requires no data science expertise
Unique Differentiation: The associative model enables dynamic data exploration—click on any data point, and AI instantly shows related information across all connected sources, revealing relationships you never knew existed.
Business Value: A financial services firm used Qlik’s associative AI to identify previously unknown correlations between customer behavior patterns and risk factors, improving their underwriting accuracy by 22% and reducing defaults by $3.4 million annually.
Real-World Case Studies: AI Visualization Transforming Business
Case Study: E-commerce Growth Acceleration Through AI Insights
The Challenge: A rapidly growing e-commerce company struggled to understand customer behavior across multiple touchpoints. Marketing spend was inefficient, customer acquisition costs were rising, and valuable revenue opportunities were being missed due to data silos and manual reporting processes.
The Solution: Implemented Google Looker Studio with AI-enhanced templates for comprehensive customer journey analysis and automated performance monitoring across all marketing channels.
AI Features Deployed:
- Predictive customer lifetime value modeling using machine learning algorithms
- Automated anomaly detection for conversion rates with intelligent alerting
- Natural language summaries of campaign performance that non-technical stakeholders could understand
- Smart customer segmentation based on behavioral patterns and purchase history
Measurable Business Results:
- 45% improvement in marketing automation ROI within 3 months
- 31% increase in customer retention through AI-identified intervention opportunities
- 67% reduction in time spent on manual data reporting and analysis
- $180,000 annual savings compared to enterprise BI alternatives
- 28% faster identification of high-value customer segments
Game-Changing Insight: The AI automatically identified that customers who viewed product videos were 3.2x more likely to make repeat purchases and had 47% higher average order values. This single discovery led to a complete content strategy overhaul that generated an additional $890,000 in annual revenue.
The Future of AI-Powered Data Visualization
AI data visualization tools are rapidly evolving beyond simple chart generation toward intelligent business partnerships that anticipate needs and suggest strategic actions.
Emerging Capabilities Reshaping Analytics
Conversational Business Intelligence is becoming sophisticated enough to handle complex, multi-part queries and remember context across conversations. Soon, you’ll collaborate with AI assistants that understand your business goals and proactively surface relevant insights.
Predictive Visualization goes beyond historical analysis to show probable future scenarios with confidence intervals and recommendation paths. AI tools for data visualization will automatically model “what-if” scenarios based on your questions.
Automated Storytelling transforms raw insights into compelling business narratives, complete with context, implications, and recommended actions tailored to different audience levels.
Strategic Implementation Considerations
While AI dramatically enhances analytical capabilities, successful implementation requires balancing automation with human insight. The most effective best AI data visualization tools augment human decision-making rather than replacing strategic thinking.
Focus on platforms that enhance your team’s existing skills while reducing manual work. The goal is democratizing insights while maintaining the human judgment that drives business strategy.
Why Beast Metrics Stands Out in the Reporting Space
In my experience working with various reporting solutions, I’ve found that most companies offer one-size-fits-all dashboard templates that don’t quite address the real challenges agencies and data teams face. However, Beast Metrics takes a refreshingly different approach by actually understanding how modern businesses operate day-to-day with AI tools for data visualization.
Our Looker Studio visualizations solve the specific headaches I’ve encountered countless times: explaining complex results to non-technical stakeholders, tracking multiple data sources simultaneously, and maintaining professional branding across all reports. What I’m particularly proud of is that each template comes with the exact KPIs businesses actually use (not just vanity metrics), includes client-friendly explanations built right in, and offers genuine customization without requiring you to rebuild everything from scratch.
What Beast Metrics Provides:
- Save 15+ Hours Per Report: Pre-built templates eliminate manual dashboard creation, allowing teams to focus on analysis rather than design
- AI-Optimized Templates: Professional dashboards specifically designed to leverage Google Looker Studio’s AI features for maximum insight generation
- Business-Focused Metrics: Templates include the KPIs that actually drive decisions, not just impressive-looking numbers
- Instant Professional Branding: Customizable designs that maintain consistency across all your data visualization tools
Instead of forcing you to change your workflow to match our system, we’ve designed our templates around how successful teams already work with AI data visualization tools—which is why they feel so intuitive and deliver immediate results from the first use. The integration between our templates and Looker Studio’s AI capabilities means you get enterprise-quality automated insights at a fraction of traditional BI costs.
Conclusion: Transform Your Data Strategy with AI
AI-powered data visualization tools represent more than technological advancement—they’re reshaping how organizations compete and make decisions. The ability to ask natural language questions, automatically discover hidden insights, and predict future trends democratizes analytics in ways that seemed impossible just five years ago.
Strategic Takeaways for Implementation Success
Speed Creates Competitive Advantage: Organizations using AI tools for data visualization achieve 28% faster time-to-insight, enabling quicker strategic responses and market adaptation that directly impact bottom-line results.
Accessibility Drives Adoption: Natural language querying and automated insights make sophisticated analytics accessible to non-technical users, unlocking organizational intelligence previously trapped in specialized roles.
Free Solutions Compete Effectively: Google Looker Studio’s AI enhancements genuinely rival premium platforms for most use cases, especially when enhanced with professional templates and optimization strategies.
Implementation Strategy Trumps Features: Success depends more on user adoption and business alignment than feature complexity. Choose tools your team will actually use consistently rather than platforms with impressive but unused capabilities.
ROI Is Measurable and Significant: Companies consistently report $13+ return for every dollar invested in advanced analytics capabilities, with payback periods typically under 12 months when properly implemented.
The Competitive Reality
Over 73% of organizations worldwide are either using or piloting AI in core business functions. The competitive advantage is rapidly shifting toward teams that can transform data into decisions faster than their competition.
Whether you choose Power BI for Microsoft integration, Tableau for advanced analytics, ThoughtSpot for search-driven insights, or Looker Studio for cost-effective AI features, the key is selecting a platform your team will use consistently to drive measurable business outcomes.
The companies that master AI data visualization tools today will set the strategic pace for their industries tomorrow. Your data is already there—the question is how quickly you can transform it into competitive advantage.
